In August 2021, the page experience signal for ranking in Google Search Engine Result Page (SERP) was rolled out fully, and it included several signals, one of which is the Core Web Vitals.
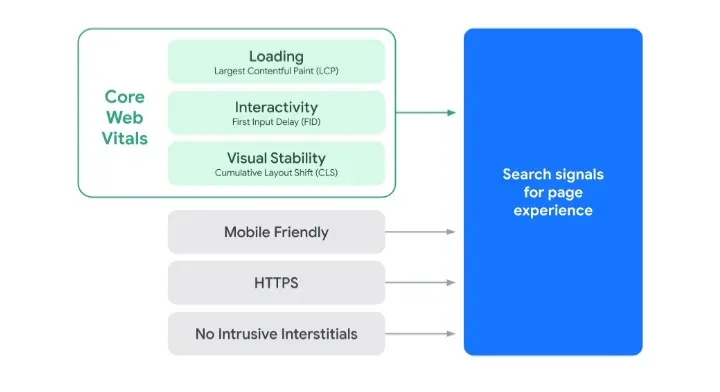
Ever since then, the core web vital metrics have been important signals that every website owner or SEO specialist checks when improving their page experience.
To help you achieve your goal of improving your page experience, I decided to write this guide on the topic “how to check the core web vitals of your webpages”.
Why should I care about checking the Core web Vitals of my website?
Google Core Web Vitals include three metrics that help understand the load performance, responsiveness, and layout stability of the pages on your website. These metrics are:
And having a green flag on these core web vital metrics gives you an edge over your competitors on the Search Engine Result Page (SERP).
Aside from the fact that checking these metrics and improving the scores on each of them can increase your chance of ranking on the first page of the SERP, they are also user-centric metrics.
Ok, let me explain what I mean by the word “user-centric metrics”. The Google Core Web Vital metrics give you a view of the experience of your users on your website; your User Experience (UX).
- The LCP helps you know if your users have to spend too much time looking at a blank page after opening your webpage.
- The FID helps you know if users of your webpage experience a delay when interacting with your webpage while it is loading.
- The CLS tells you how stable the elements on your webpage are as the page loads. So, you get to know if users are finding it difficult to navigate your webpage.
So even if getting to the first page on the SERP is not your goal, working on improving your scores on each of the core web vital metrics is worth it, and the fact that it helps you improve the experience of your users is enough reason for you to check your core web vitals.
The Three-Step Workflow.
It is also essential to know that when working on your core web vitals, it is not just about checking them.
If you are to keep your core web vitals in a good state and maintain their scores, you have to go further than just checking the metrics, and that is why you have the three-step workflow for keeping core web vitals in a good state.
This three-step workflow is recommended by Google, and it includes:
- Check your core web vitals (This is what this article will focus on).
- Optimize your core web vital score.
- Monitor your core web vitals.
And each of these stages is very important, but we will be focusing on checking your web vitals. So let’s get to the guide.
How To Check Your Core Web Vitals.
Checking, or should I use the word “measuring”, your core web vitals can be done by taking the following steps:
Choose a tool:
There are a lot of available tools that can help you check your core web vitals, both the lab tools and the field tools, and because of that, knowing the right tool to use can be challenging.
To help you in making the right choice, I will show you five tools that are used in checking the core web vitals and how they are used. But before that, you need to understand what these two terms, Lab Tools and Field Tools mean, as I will be using these terms often throughout this article.
Lab Tools and Field Tools.
The Lab tools check your core web vitals by stimulating interactions with your web page. It then measures its experience with the webpage and provides the Lab data of the page.
It is essential to know that the report (lab data) a lab tool will provide to you on your core web vital might be different from what your users are actually experiencing, and that is why you have the field tools.
The Field Tools check your core web vitals by monitoring the experience of actual users on your website, which is called Real User Monitoring (RUM). It observes your site users on the field and provides you with the Field data of your website.
To measure the core web vital of your website with the field tools, you will have to depend on your users, and you get to fix any issue your user are facing while using your website.
But when you have low traffic to your website, using the field tools will not be an effective way to check your core web vital as the tool will have little data to work with while providing you with the score of your LCP, FID and CLS.
Now you know what a Field tool and a Lab tool are, let’s get to the five different tools you can use to measure your core web vital and get to know which is a field tool or lab tool.
1. Lighthouse:
This is a tool owned by Google that you can use to check the core web vitals of a website, including other web vital metrics and audits.

“Lighthouse is an open-source, automated tool for improving the quality of web pages. You can run it against any web page, either public or requiring authentication. It has audits for performance, accessibility, progressive web apps, SEO and more.”
Source: Google Developers.
When measuring your core web vitals using Lighthouse, you get to see your LCP score and CLS score, but because Lighthouse is a Lab tool, you can’t use it to check your FID score, and this is because First Input Delay can only be measured in the field, but Lighthouse provides an alternative metric which is Total Blocking Time (TBT) which is quite similar to the First Input Delay (FID).
How to use Lighthouse to check Core Web Vitals:
1. Open your Chrome browser for desktops.
2. Add the Lighthouse Chrome Extension to your browser.
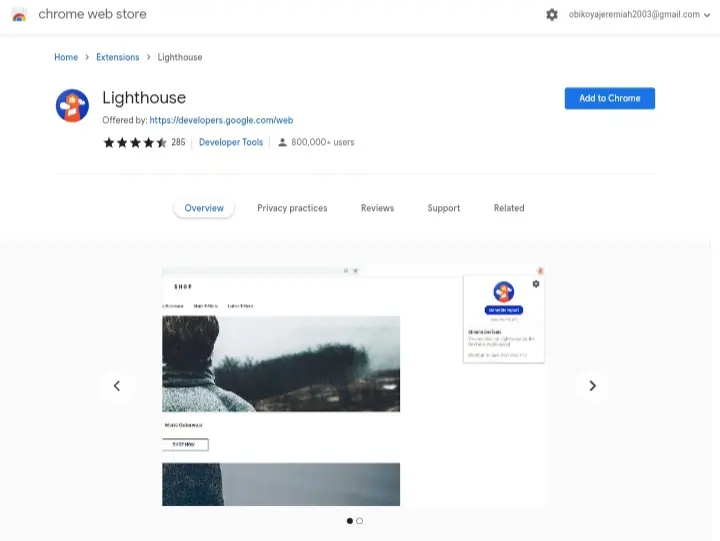
3. Go to the page you want to audit on your browser.
4. Click on the Lighthouse icon next to the Chrome address bar.
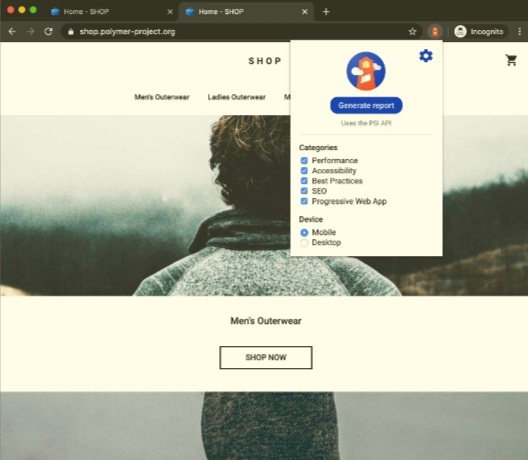
5. Click Generate report and wait for the report to be generated.
I mentioned before that Lighthouse also checks other web vital metrics apart from the three core ones, and it also performs other audits on your website. But we are concerned about the core web vital for now, and this is where you can find these metrics.
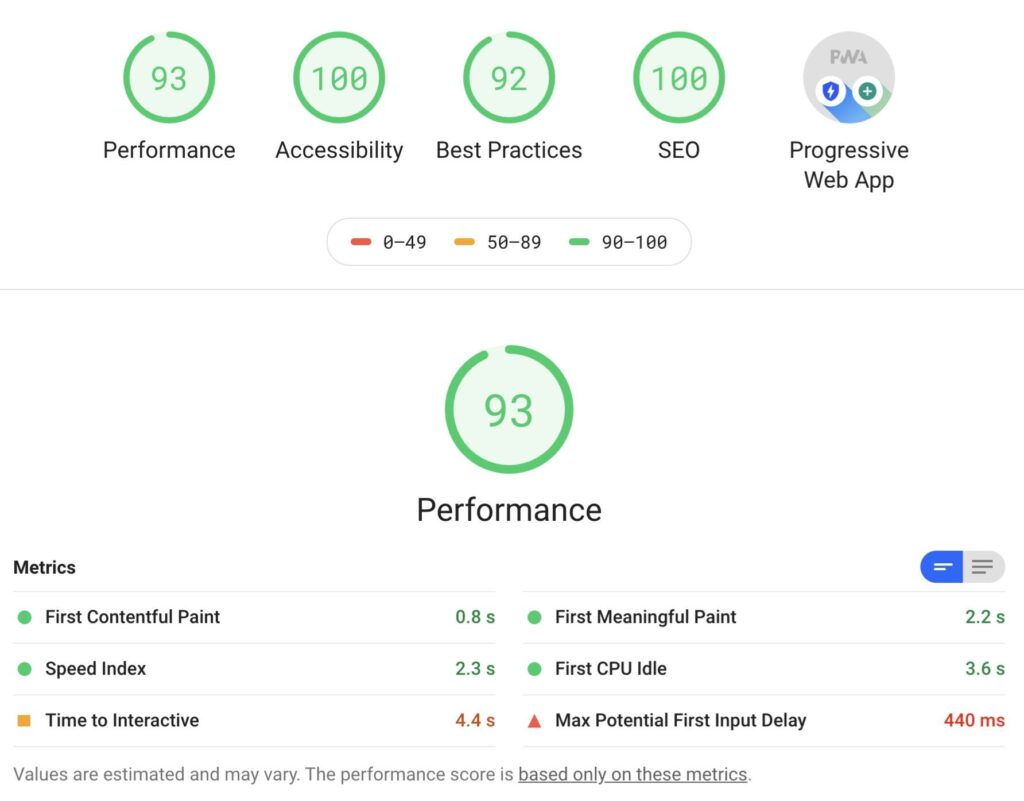
There are also other ways of using Lighthouse to check your core web vitals but using the chrome extension, just as I have explained above, is the easiest way to use Lighthouse.
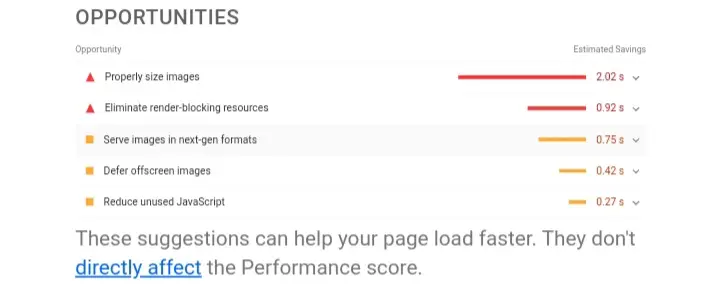
Lighthouse also offers suggestions on how you can get the issues on your website fixed, and all these are listed in the Opportunity section of the report.
2. Google Search Console:

You probably should know what Google Search Console is and what it is used for when working with a website. Well, Google Search Console can also be used to check the core web vitals of the properties added to it, but if you haven’t added your website to Google Search Console, you can’t use it in checking your core web vitals.
To add your website to Google Search Console, click here and follow the procedures. But if you have it added before, here is how to use it to check your core web vitals.
How to use Google Search Console to check your core web vitals.
1. Go to Google Search Console.
2. Click on “Experience”, which is on the tab.
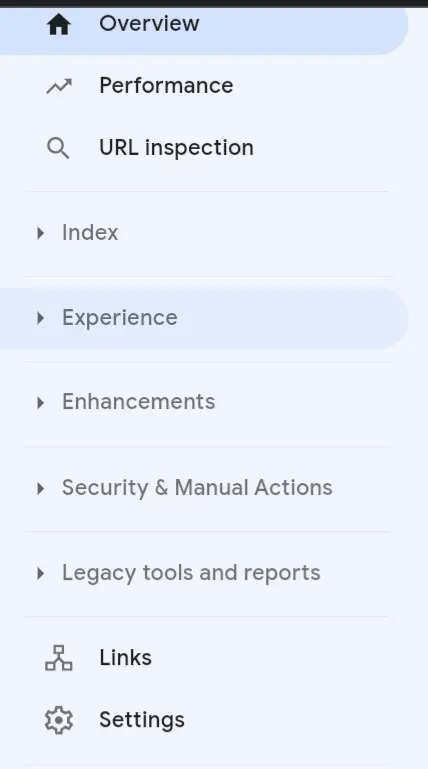
3. Click on core web vital.
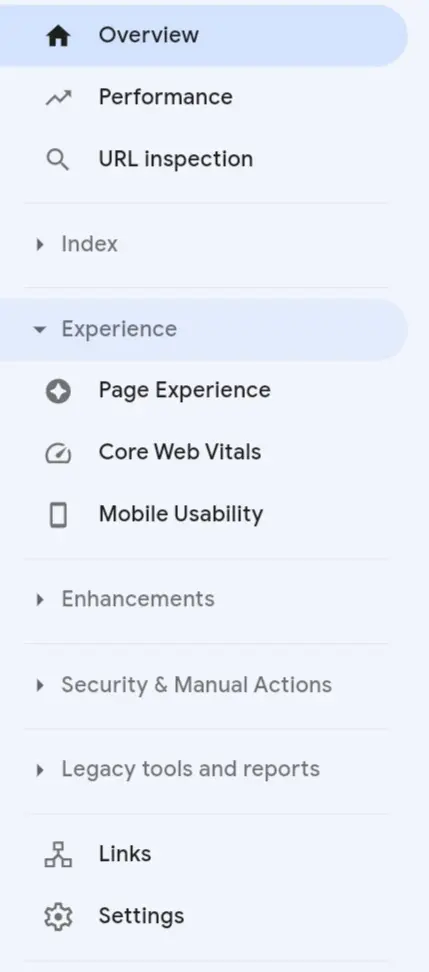
4. And there, you will find your core web vital report for mobile and desktop.
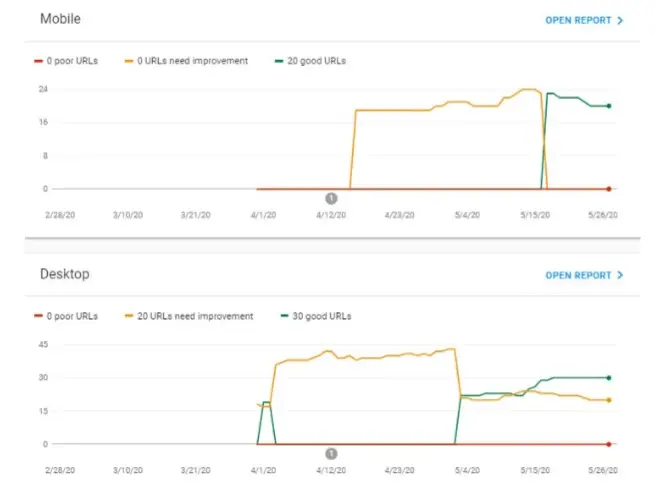
Google Search Console is a field tool, and it gets its field data from Chrome User Experience Report (CrUX). Just as I said earlier, if you have very low traffic to your website, then this field tool isn’t for you.
Also, CrUX gets its field data only by monitoring users of your website that make use of the Chrome browse, so if a considerable percentage of your traffic doesn’t come from Chrome, you need to pick another tool to check your core web vitals.
3. PageSpeed Insights:

PageSpeed Insights is another tool from Google that you can use to check your core web vitals. It checks how your website performs both on mobile and desktop.
PageSpeed Insight combines the report from Lighthouse and Chrome User Experience (CrUX) and puts them together so you can check them all in one place.
So we can say that the report from Lighthouse plus that from Google Search Console equals the report you will get from PageSpeed Insight, and for this, PageSpeed Insight is a Lab tool and a field tool.
How to use PageSpeed Insight to check your core web vitals:
1. Go to PageSpeed Insight.
2. Enter your webpage URL
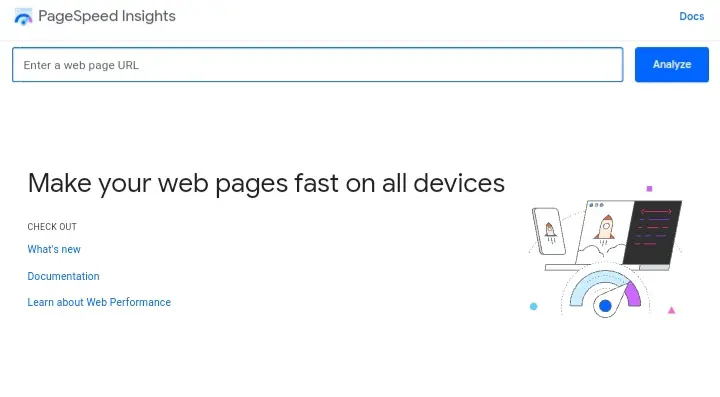
3. Click Analyze
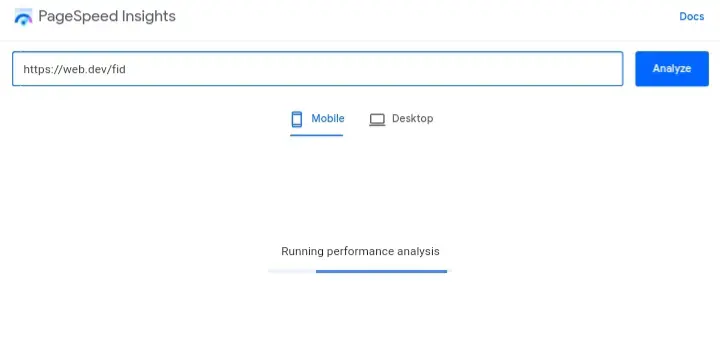
After a few seconds, PageSpeed Insight displays the analysis report containing the field data and lab data from your webpage.
The field data on your core web vital can be found in the section that says, “Discover what your real users are experiencing.”
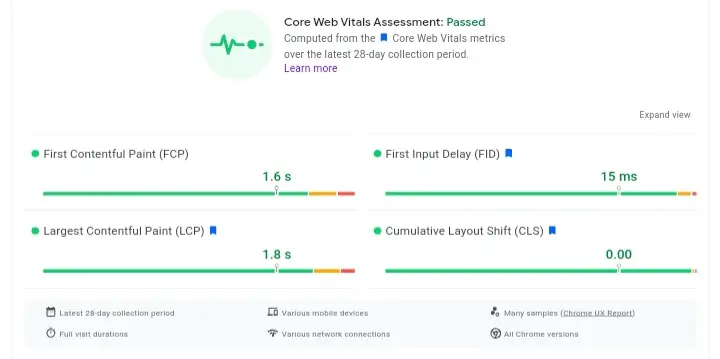
While the lab data is displayed just the way, it is in Lighthouse.
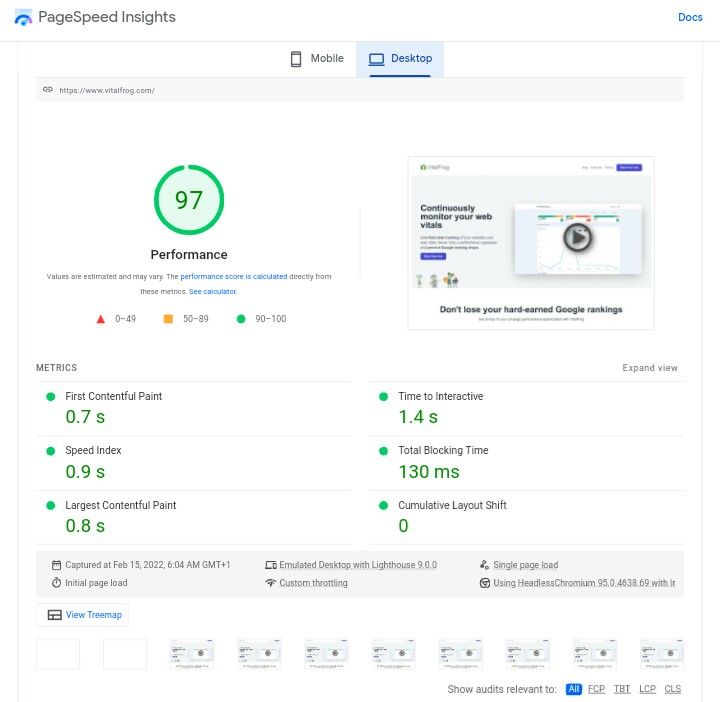
4. GTmetrix:

GTmetrix is a tool that you can use to analyse your website performance and checks your core web vitals. It also uses a grading system to grade your website performance and structure in percentage.
GTmetrix analyses your website in the lab, so it can not be used to check your First Input Delay (FID) score. Like Lighthouse, GTmetrix uses Total Blocking Time (TBT) as an alternative.
How to use GTmetrix to check your core web vitals.
1. Go to GTmetrix.
2. Enter the URL of the page you want to analyze.
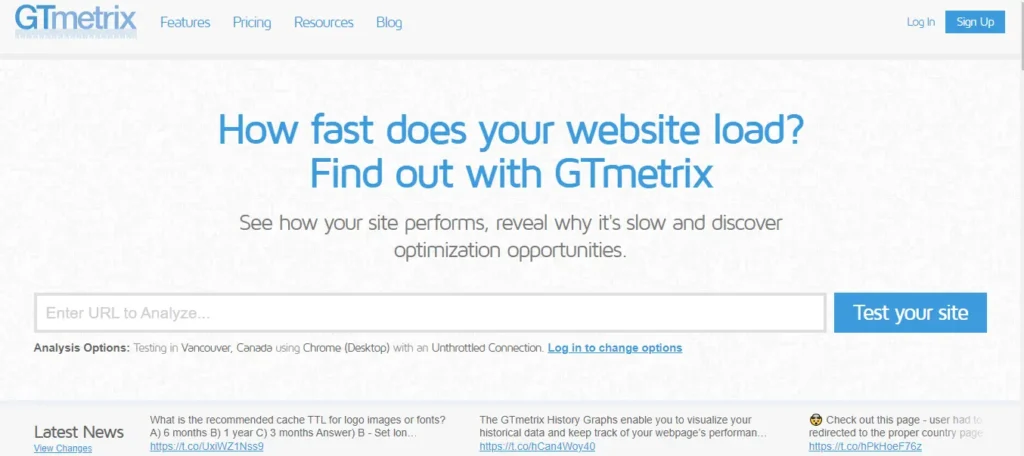
3. Click “Test your site”.
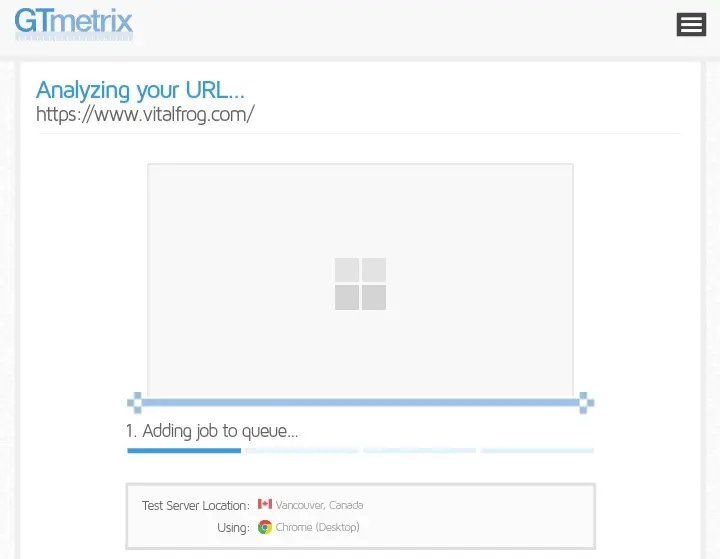
4. GTmetrix metrics, then analyze your page.
The report contains various audits of your website.
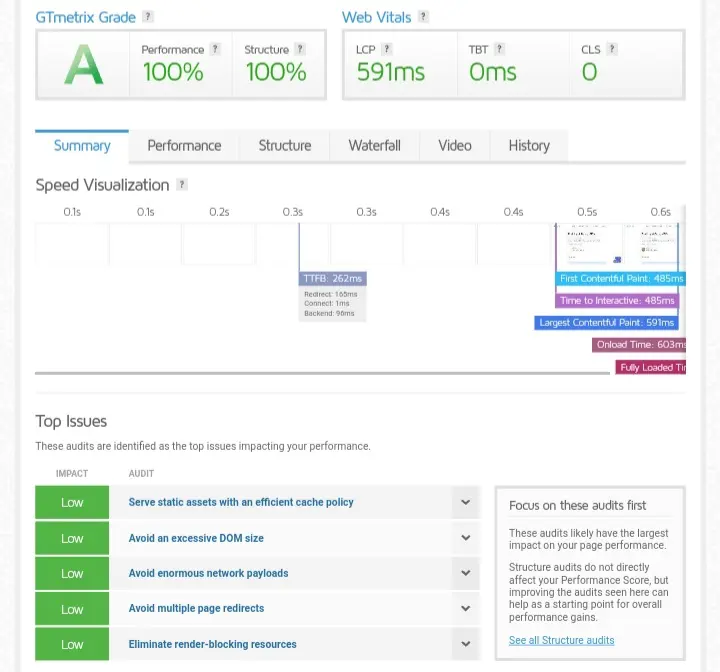
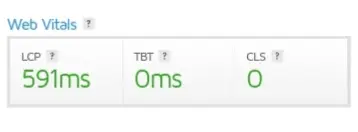
But this is where you find your core web vital metrics.
5. VitalFrog:
VitalFrog is a tool we made to help you monitor your website performance and check your core web vital metrics.

Just like PageSpeed Insights, VitalFrog provides you with the field data and the lab data on your web vital metrics, but the only difference here is that VitalFrog can analyze all the pages on your website once you provide the URL to a page. You don’t need to check the core web vital of your webpages severally.
How to use VitalFrog to check your core web vitals.
1. Go to VitalFrog.
2. Enter the URL you want to analyze.

3. Click Get Report.
Then wait for VitalFrog to run the report on your core web vital metrics.

When it is done, you are then provided with the Lab data on your core web vital, including other web vital metrics for both mobile and desktop.
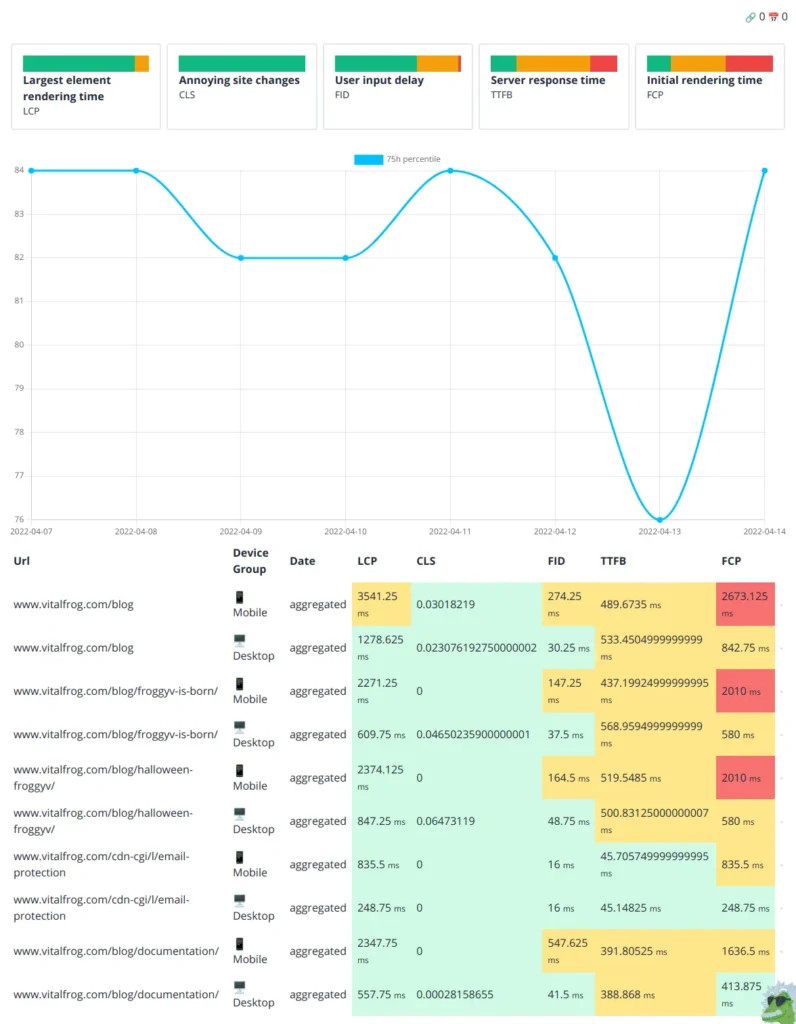
You can access the field data by clicking on Field Data. But to view this real user data, you need to get an account with VitalFrog, as this will enable us to monitor the experience of users on your website and report your core web vital metrics (field data).
Now you are done with the first step in this guide on checking your core web vitals, and you now know five different tools you can use to check your core web vitals, but which of these tools should you use?
To answer that, I would advise you to make use of a tool that can help you in checking the lab data and the field data all in one place, so you don’t have to use different tools for different data.
Here is a tabular summary of the five tools I explained above.
| Tools | Provides field data | Provides lab data | Owned by Google | Checks multiple URLs at once |
|---|---|---|---|---|
| Lighthouse | ❌ | ✔ | ✔ | ❌ |
| Google Search Console | ✔ | ❌ | ✔ | ❌ |
| PageSpeed Insight | ✔ | ✔ | ✔ | ❌ |
| GTmetrix | ❌ | ✔ | ❌ | ❌ |
| VitalFrog | ✔ | ✔ | ❌ | ✔ |
Now let’s move to the next step, where I will explain to you what the report means and how to identify issues that need to be fixed.
Understand the report from the tool.
After you enter your URL in any of the tools I have shown you above, you will get a report in which you can find your core web vital metrics scores. But of what use is the scores if you don’t understand what the report is pointing at?
And that is why I made this the next step in this guide. I will be explaining the reports from the tools I have shown you above so you get a complete understanding of what you are checking.
Since we are focusing on the core web vital metrics, how do you know when you have a good score in these metrics and when the score is bad?
In the various tools I explained earlier, there is always a colour code seen with the score on each of the metrics. When you see green, you have a good score on that metric.
When it is yellow or orange, it shows that the metric needs improvement, and when it is red, then you know that your score on that metric is bad, and at this point, it indicates that your users are having a bad experience with your website and you need to fix it.
According to Google, here is a table that shows the good or bad scores on the LCP, FID and CLS.
| Core Web Vital Metrics | Good | Need Improvement | Bad |
|---|---|---|---|
| Largest Contentful Paint (LCP) | 0 – 2500 ms | 2500 – 4000 ms | Above 4000 ms |
| First Input Delay (FID) | 0 – 100 ms | 100 – 300 ms | Above 300 ms |
| Cumulative Layout Shift (CLS) | 0 – 0.1 | 0.1 – 0.25 | Above 0.25 |
And this will guide you to identify when there is an issue with your core web vital while checking it with any tool. Although, the LCP score in some tools may be given in seconds and not in milliseconds as they are in the table above.
Now you have completed the first step in the three-step workflow for ensuring your website’s Core Web Vitals stay healthy as recommended by Google.
Remember the three-step workflow include:
Now the next step to take is to optimize your core web vital score.
Optimize your core web vital score.
I have walked you through the first step, “check your core web vital”, and now you understand the scores and know when it is good, need improvement or is bad. If your score is bad or needs improvement, then the next step is to optimize it, and this can be achieved in different ways.
We have articles in our blog that goes into detail and explains the various ways of improving your score on each of the core web vital metrics. Click on the core web vital you want to improve, and you will be direct to the article.
After optimizing your core web vital scores, you need to monitor them so things don’t change without you knowing, and this leads us to the last step in the three-step workflow for ensuring your website’s Core Web Vitals stay healthy.
Monitor your core web vitals.
This is an important step that should not be neglected as your core web vitals scores can change at any time, and you want to be the first to know of the changes, not Google, so you need a system in place to check your core web vitals.
From the research made by Google developers, it was shown that most of the improvements made to a website’s performance tend to regress within six months. This means that these metrics must be monitored, both the lab data and field data.
But taking up the task of checking your core web vital score from time to time can be quite stressful, and that is why you have tools like VitalFrog, which can help you monitor your website performance and core web vital. When it finds any negative change in the scores, it alerts you immediately.
Monitoring your core web vital with VitalFrog requires that you sign up with us and subscribe for an account, and we handle the rest by providing you with both the lab data and field data of your website and monitoring them frequently.
Now that you are done with the three-step workflow for maintaining a good core web vital score, you can move further to do the same for other web vital metrics like:
Conclusion.
To check your core web vital, you need to follow two steps which are:
And I have explained each of these steps in this article to guide you in checking your core web vitals and understand what you are checking so you can take the proper steps to improve your core web vital scores.
Even after improving or optimizing your core web vital, you also need to set up a system to monitor your website performance regularly. Research says that the score can regress within six months, and you don’t want that to happen without you being aware.
VitalFrog can help you check your core web vital score and also monitor them for you, so you don’t have to worry about losing your Google rankings because of an issue with your core web vital.
Try VitalFrog today and check out your core web vital.