Summary
Do you want your website to rank well in Google search engines? If you want to rank on the first page of the search engine or Google snippet, you need to pay attention to Core Web Vitals.
Core Web Vitals determine whether your website will rank well in search engines or not.
For websites, it’s about drawing users to your site and maintaining them as regular users through digital marketing. This also extends to generating referral traffic to a particular site.
Maintaining site visitors and increasing audience numbers rely on facilitating an excellent user experience.
Introduction to Core Web Vitals
Google introduced Core Web Vitals as a means to measure user experience (UX). These are Google’s latest ranking signals, and they are not to be ignored, as this is part of Google’s Page Experience update.
From research, websites managers who paid closer attention to Core Web Vitals, discovered a rapid boost weeks after the latest Google’s Page Experience update in their organic rankings. Organic rankings dropped up to 20% of those who didn’t pay attention to this.
This shows the importance of Core Web Vitals to your company.
We can confirm that these new metrics are well and truly in effect, with ranking positions being affected across multiple industries in Google search results.
If you haven’t reviewed your site’s Core Web Vitals, we highly recommend doing so now. Our team of SEO specialists have put together a handy guide to help you understand what exactly Core Web Vitals are and why they are so important to improve.
What are Core Web Vitals?
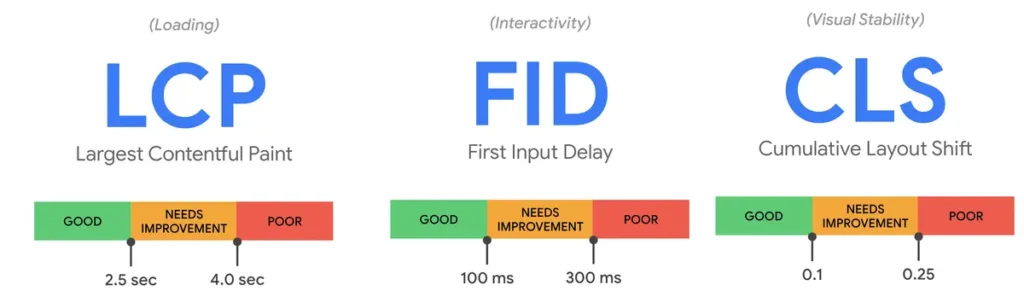
Core Web Vitals are three significant metrics used by search engines like Google to score user experience while browsing through a webpage. These metrics are The Largest Contentful Paint (LCP), Cumulative Layout Shift (CLS) and First Input Delay (FID).
These metrics score how fast the largest content loads on a page load, how fast that webpage can respond to a user’s input, and how unstable the content is as it loads in the browser
Largest Contentful Paint (LCP)
The largest contentful paint (LCP) is one of the three Core Web Vitals that determines how long it takes for a page to load. While working or browsing alone, you may have heard about things like DOM or DOMContentLoad in the past. Largest Contentful Paint is similar, but Google is claiming that this is a simpler measurement that focuses on how long it takes the largest image or text block to load.
You will agree with me that users enjoy a website that loads very fast. The time it takes a website to load is a critical factor for page experience. A page that loads quickly is more likely to rank higher in Google. Pages that load slowly have a negative impact on engagement and conversion rates compared to a page with fast loading pages.
Note: To provide a good user experience, LCP should occur within 2.5 seconds of when the page first starts loading.
Cumulative Layout Shift (CLS)
The next Core Web Vitals measure the visual stability of a page. Have you ever visited a webpage and when you are about to interact with the page the content (button, text, video) shifts up or down? This is an example of Cumulative Layout Shift (CLS).
Cumulative Layout Shift (CLS) was actually introduced in Lighthouse in 2020. This performance metric measures the perceived visual stability of a page load. Simply put, CLS measures the unexpected shifting of web elements while the page is being rendered.
Sometimes more than one element shifted or shifted multiple times. As you guessed, this is a terrible user experience.
A good user experience helps improve usability, drive click-through rates, and improve online sales.
Note: To provide a good user experience, pages should maintain a CLS of 0.1 or less.
First Input Delay (FID)
The next Core Web Vital measures how fast the page responds when users interact with various elements on the page. First Input Delay is the time difference it takes between when a user takes an action and when the page responds to the user input. The user takes an action through a click, a scroll, a keypress and more.
For example, when a user clicks on the signup button on a membership/login page, First Input Delay (FID) helps to calculate the time a user has to wait before responding to his action on the page.
Google advises a good webpage is one that maintains the FID of 100 milliseconds or fewer. This means the result generated from a user action should be equal to or less than 100 milliseconds.
When a page is delayed in responding to user inputs, that user gets frustrated. First Input Delay (FID) tends to measure the level of user frustration. It determines if a user is happy with your page or not.
Developers need to reduce the time users spend waiting for a browser to respond to their input to improve engagement and usability across the site.
Note: To provide a good user experience, pages should have the FID of 100 milliseconds or fewer.
Other Performance Metrics
There are 5 other performance metrics website owners require to take into account while focusing on user experience. Although, we have named the three major Core Web Vitals.
The 5 performance metrics listed below are not considered part of the page user experience, but they quantify other technical factors that can negatively impact how people engage with your website. So let’s dive right in!!!
First Contentful Paint
First Contentful Paint (FCP) measures how long it takes a user to see the first content on your webpage i.e DOM content (images, text and so on) while visiting your website. Usually, web pages that are fast are rendered between 0–2 seconds, moderate websites are rendered between 2–4 seconds and slow websites are rendered 4+ seconds.

How Lighthouse determines your FCP score
FCP of your website is usually a comparison of your page’s FCP time and FCP times for real websites. The data is determined by the CrUX (Chrome UX Report) data. For example, websites performing in the 99th percentile always render FCP in about 1.2 seconds. See How metric scores are determined to learn how Lighthouse score thresholds are set.

This table shows how to interpret your FCP score:
FCP time
(in seconds) Color-coding
0–1.8 Green (fast)
1.8–3 Orange (moderate)
Over 3 Red (slow)
Speed Index
Speed index often measures the average times it takes a user to see the contents of your website.
How Lighthouse determines your Speed Index score
Your website Speed Index score is a comparison of your page’s speed index and the speed indices of real websites, based on the CrUX (Chrome UX Report) data.
This table shows how to interpret your mobile Speed Index score:
Speed Index
(in seconds) Color-coding
0–3.4 Green (fast)
3.4–5.8 Orange (moderate)
Over 5.8 Red (slow)
Time to Interactive
Time to Interactive (TTI) is one performance factor that measures the amount of time it takes for your webpage to become interactive. The page is interactive when it displays useful content as measured by First Contentful Pitfall (FCP), the page responds to user interactions or commands within 50 milleseconds and so on.
- 0–3.8 seconds: Green (fast)
- 3.9–7.3 seconds: Orange (moderate)
- 7.3+ seconds: Red (slow)
Total Blocking Time
This identifies how long it takes your webpage to accept and respond to a specific input of a user.

How Lighthouse determines your TTI score
The TTI score is a comparison of your page’s TTI and the TTI for real websites, based on the CrUX (Chrome UX Report) data. For example, sites performing in the ninety-ninth percentile render TTI in about 2.2 seconds. If your website’s TTI is 2.2 seconds, your TTI score is 99.
This table shows how to interpret your TTI score:
TTI metric
(in seconds) Color-coding
0–3.8 Green (fast)
3.9–7.3 Orange (moderate)
Over 7.3 Red (slow)
Page Performance Scores
The page performance score is a single metric that aggregates all the Core Web Vitals together. This score considers all the important user experience metrics in the Core Web Vitals across both mobile and desktop visits.
Why Does Google Use Core Web Vitals?
Google uses the Core Web Vitals to create a better user experience.
Google has 100% control of how users experience its search engine, but when they send a user to websites with poor user experiences, it reflects poorly on them. This became an issue for them that needed to be resolved urgently.
This led them to develop the Core Web Vitals, which forces website owners and managers to improve the user experience of their websites. A website that doesn’t have a good user experience will receive little or no traffic from Google because Google will drop your page rankings drastically.
Do I Need To Worry About Core Web Vitals?
We agree that keeping up with all Google’s algorithm updates and ranking factors can be very overwhelming, but the Core Web Vitals are ranking signals you can’t just ignore, and there’s a good reason for it.
As I said in the article above, improving your Core Web Vitals will help boost your ranking drastically, but there is a more important reason why you should pay attention to it.
The reason is that customers tend to stick with a brand that makes life easier and enjoyable for them. The major way to make life enjoyable and fun for your customers is via a great user experience.
Even if the organic search isn’t the main way customers find you, improving your user experience is still very significant.
When a website user experience is great, users find it easier to perform the desired action, whether that be a sale or filling out a form.
How Do I Check My Core Web Vitals?
There are various methods through which you can check your Core Web Vitals. In this section, I will cover three proven ways to achieve this.
Google Search Console (GSC):
Google made it possible for website owners and managers to review their Core Web Vitals through the Google Search Console. You will be able to see the grade of each Core Web Vitals for all your URLs that are currently indexed in the Google search engine. This is a great starting point for a quick review of your site’s performance across each metric.
Although it has a downside as Google may not have indexed all the URLs of your website and won’t be able to give you a specific report to help you improve your Core Web Vitals.
Google PageSpeed Insight tool
In the scenario where Google hasn’t collected enough data from your website to display your Core Web Vitals scores in GSC. If this is the case, you can visit Google’s PageSpeed Insights tool, which will also provide information on your vitals with recommendations on what you can do to improve them.
VitalFrog
With Google introducing the Core Web Vitals (CWV) and using them as an important ranking factor since May 2021 every SEO knows one thing: On-page performance can no longer be an afterthought.
After the initial hard work to get the CWVs to a point where they satisfy Googles need, it is essential to continuously keep an eye on your Web Vitals and website performance to ensure changes do not corrupt them. VitalFrog gives you an easy-to-use dashboard that visualizes your current web vital health for all your team members.
Why VitalFrog?
- Field data: We found lab data being an unreliable source of information as of why VitalFrog uses field data which is gathered from real users of your site.
- Release tagging: The VitalFrog snippet gives you a function to automatically tag your current release. This allows you to exactly find out what code change broke your core web vitals
- Fully GDPR compliant: We gather your performance data via an anonymous Chrome API and no personal identifiable data about your users is stored at VitalFrogs servers. This results in no cookie banner being required.
- Unlimited sub-pages & users: No artificial limits: After including the above JavaScript snippet, VitalFrog automatically monitors all the pages where the snippet is included. Your dashboard can be shared with as many people as you want.