Introduction
Whether you are building a website for a startup or just a simple side project, measuring core web vitals should be of utmost priority to enable your users to have a smooth user experience and rank better on Google.
So what are web Vitals? Web vitals are a specific set of metrics that Google considers important for a great web user experience. They include Mobile-friendliness, safe browsing, HTTPS, Non-intrusive interstitial, Loading, Interactivity, and Visual stability.
Only Loading (Largest Contentful Paint), Interactivity (First Input Delay), and Visual Stability (Cumulative Layout Shift) are considered the three core web vitals. If you read more about core web vitals, check out this blog.
In this article, we are going to go through how to measure core web vitals in the field using a set of listed tools.
Measuring Core Web Vitals
Lighthouse:
Lighthouse is an open-source automated website testing and performance metrics tool that is maintained by the Google-Chrome team. Lighthouse’s main focus is on include helps developers diagnose issues related to the performance and accessibility of a website.
It measures several dimensions of user experience quality in a lab environment, including performance and accessibility. The latest version of Lighthouse (6.0, released mid-May 2020) includes additional audits, new metrics, and a newly composed performance score.
How to use Lighthouse.
Lighthouse is a straightforward tool to use, make sure you have google chrome installed on your computer.
1. Visit the webpage that you intend to measure.
2. Right-click on the page and select Inspect option.
3. The Inspect option opens a panel at the top, with several options, scroll to the end, and select lighthouse.
4. Select the categories you want to audit and click generate the report.
Lighthouse can also be used as a Chrome extension.
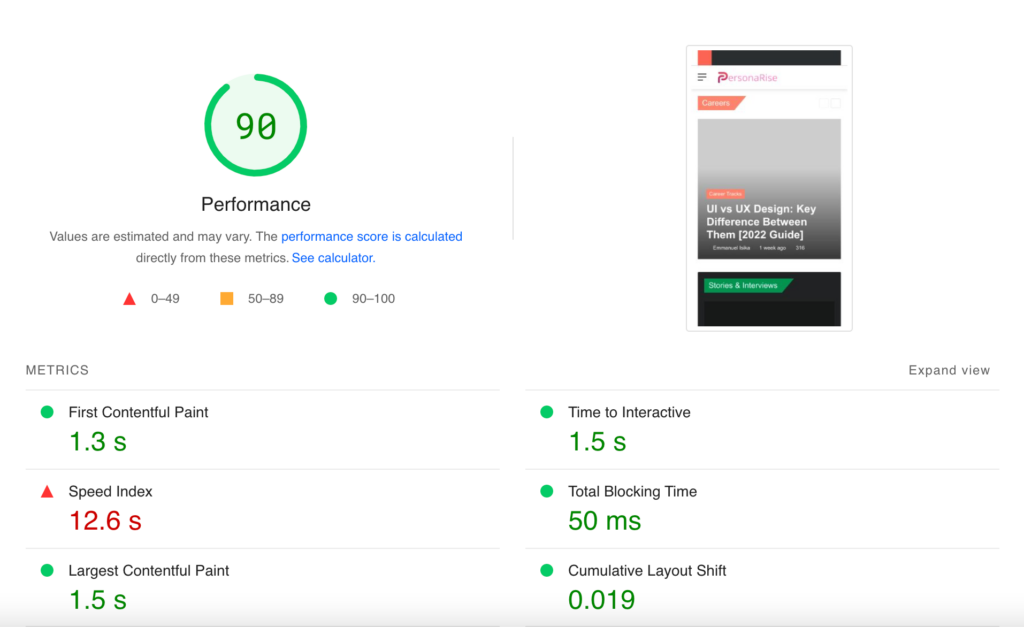
From the report, the following issues are audited, Performance, Accessibility, Best Practice, SEO, and Progressive Web App. A set of actionable recommendations are also included in the report. Below is a screenshot of a generated lighthouse report.
PageSpeed Insight:
PageSpeed Insights (PSI) is another Google tool that audits the performance of a page on both mobile and desktop devices. The tool is similar to Lighthouse but provides an in-depth report on how to maximize the load speed of your website.
PageSpeed Insights also provides an API that returns real-world data from the Chrome User Experience Report and lab data from Lighthouse.
How to use PageSpeed Insights.
The total performance score of a website is the average metric score and the weight of each metric is a representation of the user’s perception of performance. Here is a table to break down the score.
| Audit | Description | Score |
|---|---|---|
| First Contentful Paint (FCP) | The first point of interaction is when a user can see any page. | 15% |
| Speed Index (SI) | The progression of a page to page load and how fast the content is visualized. | 15% |
| Largest Contentful Paint (LCP) | The time until the bulkiest content element is fully visible on the screen. | 25% |
| Time to Interactive (TTI) | The amount of least time it takes for a page to become 100% interactive. | 15% |
| Total Blocking Time (TBT) | The extent to which a non-interactive page is until it becomes reliably interactive. | 25% |
| Cumulative Layout Shift (CLS) | How often does a UX element unexpected layout shift | 5% |
The report will include the following sections:
Performance Score: The total score of your website
Opportunities: Recommendations on how to make your site faster
Field Data: Real-world data from Google
Origin Summary: An in-depth review of core web vitals
Diagnostics: More insight on the performance of your site
Lab Data: The metrics calculated from Lighthouse
Here is an example of results from a PageSpeed Insight Report

Google Search Console:
Previously Known as the google webmaster, search console is the most extensive tool for measuring SEO and performance metrics in the field
Based on real-world (field) data from CrUX, the new Core Web Vitals report in Search Console assists you in identifying groupings of pages throughout your site that require improvement. URL performance is determined by the status, the type of the metric, and groups of similar web pages.
This report is based on the three Core Web Vitals metrics: Loading (Largest Contentful Paint), Interactivity(First Input Delay), and Visual Stability(Cumulative Layout Shift). If a webpage does not have the least required amount of reporting data the metrics, it’s not included in the report.
How To Use Google Search Console.
Google search console is such an extensive platform with tools such as URL inspector, performance, coverage, and sitemap but we are only going to focus on the core web vitals.
1. Go to search.google.com.
2. Add a property( adding domain or URL prefix)
3. Verify the property by adding a txt record to your DNS record (It may take time for the DNS changes to take effect)
4. After the first three steps you can now access the search console dashboard.
5. You now access the core web vitals at the left bar of your dashboard.
Chrome UX Report (CrUX):
The Chrome UX Report (CrUX) is a dataset that is free publicly and contains actual user experience data spanning tons of sites and applications. It analyzes the field versions of all Core Web Vitals. Unlike data obtained in the lab, CrUX data originates from real users in the field.
Using this data, you discover the measurements of real user experiences on their own or even on competitors’ sites. CrUX gives you a convenient and simple approach to analyzing your Core Web Vitals.
The CrUX data on Google’s BigQuery offers perfectly alright performance statistics for all Core Web Vitals and is accessible in monthly snapshots.
How To Use Chrome UX Report (CrUX).
There are four ways of using crUX report, PageSpeed Insights(which we have covered), CrUX API.
1. PageSpeed Insights
As we have covered in this article.
2. crUX Dashboard
The CrUX Dashboard is a Data Studio-based configurable data analysis tool for previous website performance. The data is obtained from the BigQuery dataset, and all SQL queries are processed behind the scenes for you. The dashboard depicts the distribution of user experiences as measured by key performance measures, as well as how it develops over time.
3. crUX API
crUX API provides a fast and easy way of integrating measuring core web vital in your development workflows.
4. crUX on BigQuery
The CrUX database on BigQuery, which is part of the Google Cloud Platform (GCP) and has a web and CLI, houses the datasets that collect critical UX performance indicators for leading websites. New tables covering the preceding calendar month are updated to the database regularly. Developers can use custom queries to query the data for specific information. This requires a deep understanding of SQL and also Google cloud project that is paid for.
Web-Vital Library
Web-vital is a lightweight javascript library for measuring all the Web Vitals metrics on real users in the field. This library also supports core web vitals.
Getting started with this library is easy, just install it from the node package manager using the following command:
npm install web-vitals Alternatively, you can load the library from a CDN using the following script tag.
<script type="module"> import {getCLS, getFID, getLCP} from 'https://unpkg.com/web-vitals?module'; getCLS(console.log); getFID(console.log); getLCP(console.log); </script> How to use
Every Web Vitals metric is similar to a single function with an onReport callback. This callback is triggered whenever a metric value is available and ready to be reported.
Check the code snippet below:
import {getCLS, getFID, getLCP} from 'web-vitals'; getCLS(console.log); //Cumulative Layout Shift (CLS) getFID(console.log); //First Input Delay (FID) getLCP(console.log); //Largest Contentful Paint (LCP) To report the metrics to Google Analytics
function sendToGoogleAnalytics({name, delta, id}) { gtag('event', name, { event_category: 'Web Vitals', value: Math.round(name === 'CLS' ? delta * 1000 : delta), event_label: id, non_interaction: true, }); } getCLS(sendToGoogleAnalytics); getFID(sendToGoogleAnalytics); getLCP(sendToGoogleAnalytics); Now your core web vitals can be visualized on your google analytics dashboard.
VitalFrog
All web vital core tools have reviewed in this article are great, but VitalFrog extends the capabilities from not only measuring but also monitoring.
With VitalFrog you will soon be able to get alerts in your mailbox the very moment VitalFrog finds a performance regression in your site, in addition to this, VitalFrog is fully GDPR Compliant.
Here are the full features of VitalFrog:
Field data: Because we considered lab data to be an untrustworthy source of information, VitalFrog relies on field data acquired from real users of your site.
Release tagging: The VitalFrog snippet includes a method that allows you to automatically tag your current release. This enables you to precisely determine which code change caused your basic web vitals to fail.
Fully GDPR compliant: We collect your performance statistics anonymously using the Chrome API, and no personally identifying data about your users is saved on VitalFrogs servers. As a result, no cookie banner is necessary.
Sub-pages and users are not limited: There are no artificial boundaries: After incorporating the above JavaScript snippet, VitalFrog automatically monitors any pages that contain the snippet. You may share your dashboard with as many people as you wish.
Summary
To be ranked better on Google and other Search Engines, your website must be performed well in web vital and more so core web performance.
Not only will this make your website rank better but also your users will have a better user experience
These are some of the tools we have covered in this article:
1. Lighthouse.
2. PageSpeed Insights.
3. Search Console
4. Chrome UX report (crUX)
5. Web Vitals.js Library
6. VitalFrog