It is no longer news to you that web users will not have the time to wait entirely for a slow-loading page to load before they get to do what they want to do on the page.
A slow-loading webpage will absolutely get a high bounce rate because the user is frustrated with the page and then leaves.
This is probably a good reason why you should give your website speed and performance Score your attention now.
According to the research made by Backlinko, the average page speed of sites that rank on the first page in the Google SERP (Search Engine Result Page) is 1.65 seconds, and this lets you know that having a fast webpage speed can help your SEO ranking.
It is essential to know that Google has over 200 ranking factors and your page speed and the other core web vital are just a few of the many ranking factors. Still, it is crucial to work at improving these factors because they are directly related to the UX of your webpage.
In other, for website owners to be able to measure their webpages speed, Google provides some free tools, which include:
Other tools used for measuring the speed of a webpage include:
But for the article, I will be focusing on just one of these tools, which is PageSpeed Insight.
What is PageSpeed Insight?
PageSpeed Insight is a free tool from Google which reports how a webpage performs on mobile and desktop and also gives suggestions on how the performance can be improved.
PageSpeed Insight is a tool that uses lab data and real-world data to calculate a performance score for a webpage.
PageSpeed Insight is integrated with Lighthouse and Chrome UX Report. This makes it a good tool with the ability to audit a webpage and find opportunities to improve the page’s performance, and also show how a real user experiences the page using field data.
The lab data are gotten through Lighthouse, while the field data are gotten through Chrome UX Report. With this, the PageSpeed Insight’s report can be divided into two sections which are the Field data section and the Lab data section.
Field Data Section:
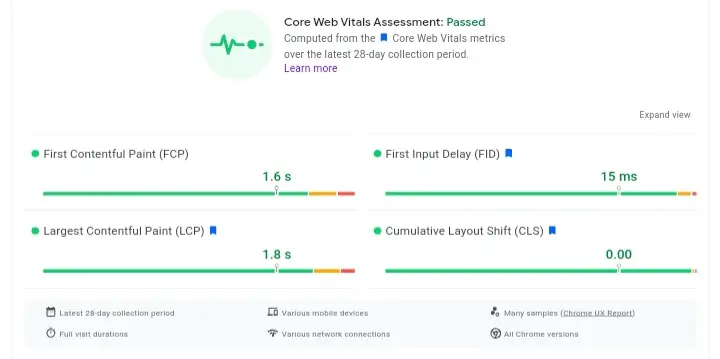
In the Field Data section, there are four metrics which are called Core Web Metrics. They include the following:
1. First Contentful Paint (FCP):
The First Contentful Paint measures the time to when the browser renders the first piece of content in the DOM, which is a non-white canvas, or SVG, providing feedback to the user that the page is loading.
2. First Input Delay (FID):
First Input Delay is the total time a browser takes to begin the process of event handlers in response to an interaction between the user and a webpage.
3. Largest Contentful Paint (LCP):
The Largest Contentful Paint measures how long it takes the most significant content on a website to become visible within the viewport relative to when the page first started loading.
4. Cumulative Layout Shift (CLS):
Cumulative Layout Shift (CLS) measures the unexpected shifting of elements in web pages while users interact with the website, especially when it is still loading. It shows how stable aspects of the webpage are while a webpage is loading.
These Core Web Vitals represent the various ways a user experiences a webpage. They focus on the speed of the webpage and also how stable the contents are on the page.
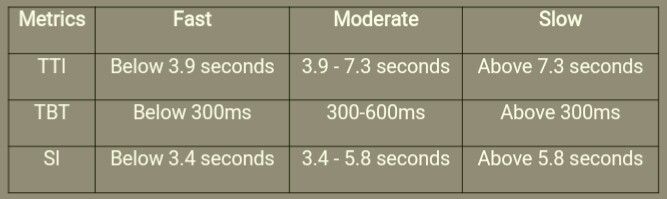
Field Data Metrics Scores and their categories:
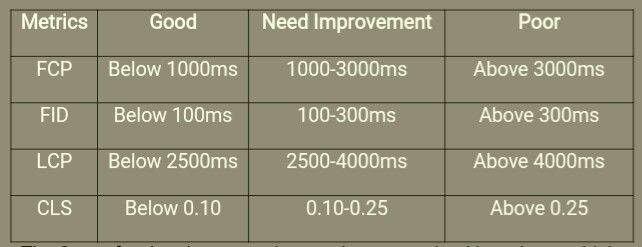
The Score for the above metrics can be categorized into three, which are good, need improvement, and poor, as given in the table above.
The values of the metrics score are color-coded according to the threshold table above, where good” values are green, those “needing improvement” are orange, and “poor” values are red.
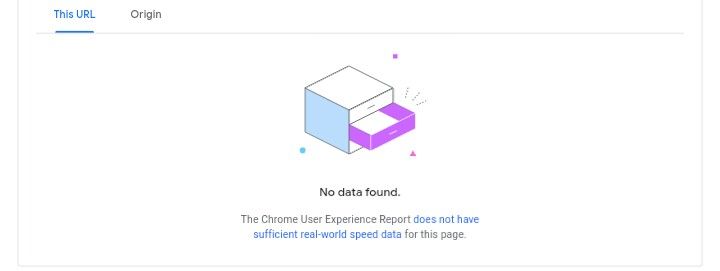
It is also important to note that when the URL you are analyzing with PageSpeed Insight is not available on the Chrome UX report, you will receive a null response (an example of this is shown in the image below), and what this indicates is that there is not enough field data for such URL.
Lab Data Section:
Three of the Core Web Vitals, which can also be found in the Field Data section, are also in the Lab Date section of PageSpeed Insight’s analysis report, along with three other metrics.
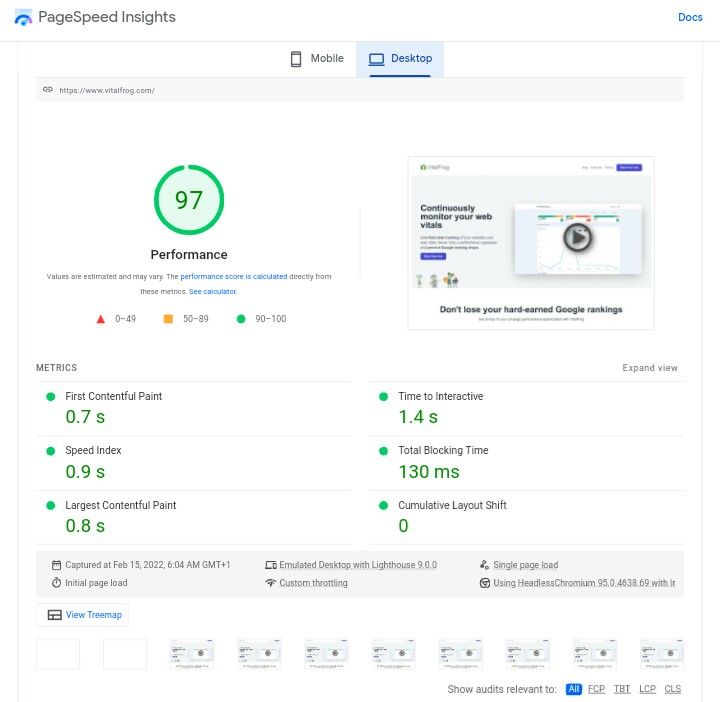
Therefore the total metrics in the Lab section is six, and they include the following:
1. Time To Interactive (TTI):
Time to interactive is a metric that measures the total time it takes for a webpage to be completely interactive and respond to user input readily.
2. Total Blocking Time (TBT):
The Total Blocking Time (TBT) is a metric that measures the total time the browser’s main thread was blocked between the FCP (First Contentful Paint) and TTI (Time to Interactive) by a task long enough to affect the responsiveness of a webpage.
3. Speed Index (SI):
The speed index is the measure of how quickly contents load and becomes visible while the webpage is loading. It measures how fast contents are visually displayed overtime during page load.
The other three metrics found in the Lab data section are:
- First Contentful Paint (FCP).
- Largest Contentful Paint (LCP).
- Cumulative Layout Shift (CLS).
Lab Data Section Metrics Scores and their categories:
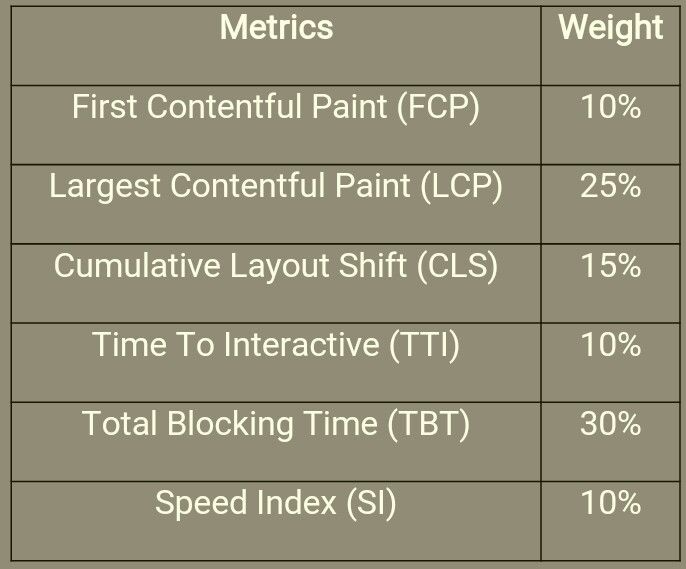
The performance score in the Lab data section is a weighted average of the score of each of the six metrics in the section.
The percentage weight of each metric is usually updated regularly, but according to that use in Lighthouse 8, here are the percentage weight of each metric:
The aggregate Performance score calculated by PageSpeed Insight in the Lab Data section is also divided into categories which are:
- Good: Scores from 90 -100.
- Need Improvement: Scores from 50 – 89.
- Poor: Scores from 1 – 49.
It is essential to know that when the score for each of the metrics is calculated, PageSpeed Insight makes use of the 75th percentile values of the metrics, and this is done to ensure that every webpage can give a user a good experience.
Also, the report on a metric in the Lab data section might sometimes be different from that you will get from the Field data section, and this is because the Field data are collected from various users who have visited your site. The report from this section can be affected by multiple conditions.
But the Lab data is collected with the aid of a predefined device and a network setting under a controlled environment.
For more information on the difference between the Field data report and Lab data report, click here.
Audits.
The audit of a webpage by PageSpeed Insight in the Lab data section is divided into three sections where each section provides different information on the webpage speed.
The audit’s section include:
1. Opportunities Section:
The opportunities section provides you with suggestions on how your webpage performance metrics can be improved so as to improve the page’s speed.
This section contains a list of opportunities that you need to tap into for the better performance of your webpage.
The part of a webpage that is slowing down the render time will be listed in this section, and what you need to do to improve them will be provided as well.
One unique aspect of this section is that it estimates how fast a webpage would become if the suggestions provided are appropriately implemented.
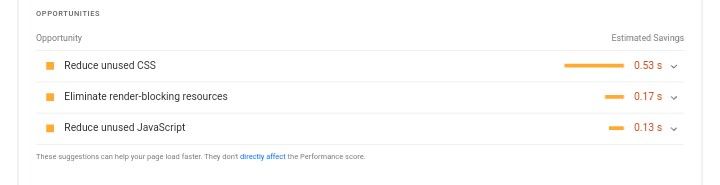
Looking at the image above, which is a screenshot from the PageSpeed Insight’s analysis report of our homepage, we can find three suggestions in the Opportunities section, which are:
- Reduce unused CSS.
- Eliminate render-blocking resources.
- Reduce unused JavaScript.
All these suggestions are general steps to take in other to increase the speed of a webpage and also improve the score of each of the metrics in the Lab data section and the Field data section.
Along with each of these suggestions are drop-downs with additional information on the suggestions, what you need to do, and what metrics it affects. (See image below).
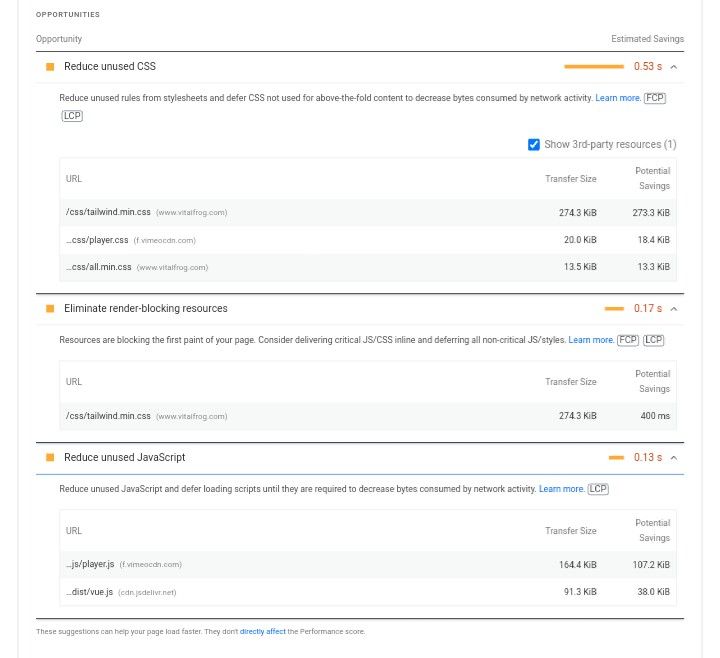
Though your opportunities section might contain more suggestions than ours, if you can work on each of the provided suggestions and appropriately implement them, the speed of your webpage would significantly improve, and your Performance Score would be affected positively.
The ability to get useful information from the opportunities section on how and what you should do to improve the speed of your webpage is what makes this section the most important of all other sections.
2. Diagnostics Section:
This section gives additional information on how a page reacts to some of the best practices in web development.
This section draws your attention to some best practices that you have not implemented in your webpage and lets you know what to do to help.
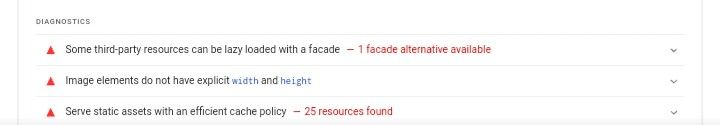
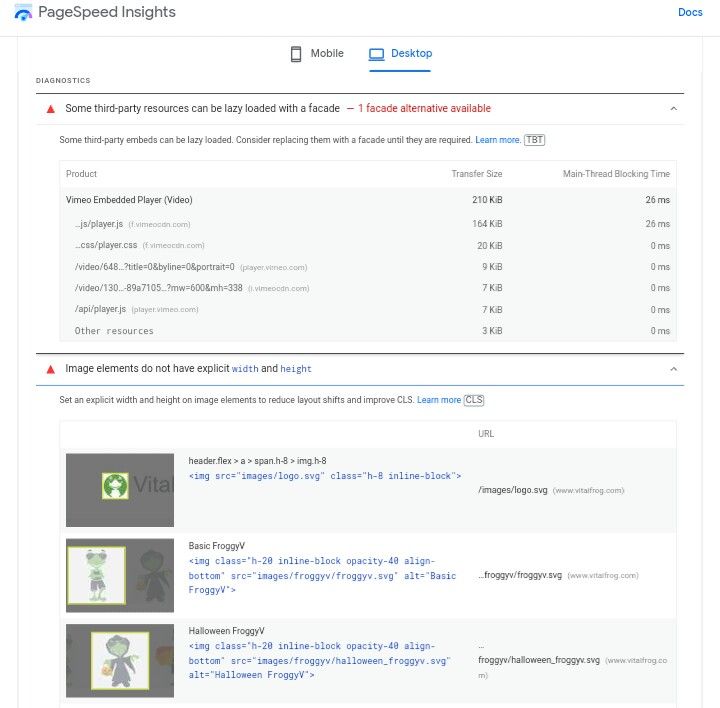
The image above is the Diagnostics section of our PageSpeed Insight report, and it contains three diagnoses which are:
- Some third-party resources can be lazy-loaded with facades.
- Image elements do not have explicit width and height.
- Serve static assets with an efficient cache policy.
And these diagnoses draw our team’s attention to the best practices that we need to implement. Just like the opportunities section, there is also a drop-down for each of the diagnoses, which provides further information.
3. Passed Audits Section:
The Passed Audits section contains a list of the many audits that a page has passed. The list can be made viable by clicking on “show” and can be hidden when the “hide” button is used.
The goal you have here is to increase the number of audits your webpage passes, and this will improve your performance score significantly.
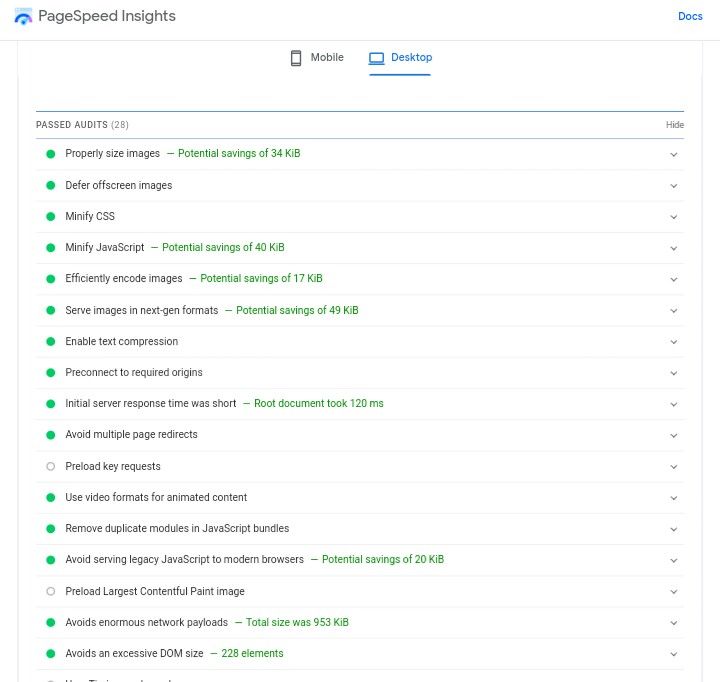
Here is the passed audit section from our PageSpeed Insight report, and it lets us know what audit our home page pages.
This section also has a drop-down providing additional information on the audit a webpage pass.
How to make use of PageSpeed Insight.
PageSpeed Insight is a simple tool to use because it has a friendly and easy-to-use User Interface (UI).
Here are the steps to take to make use of PageSpeed Insight:
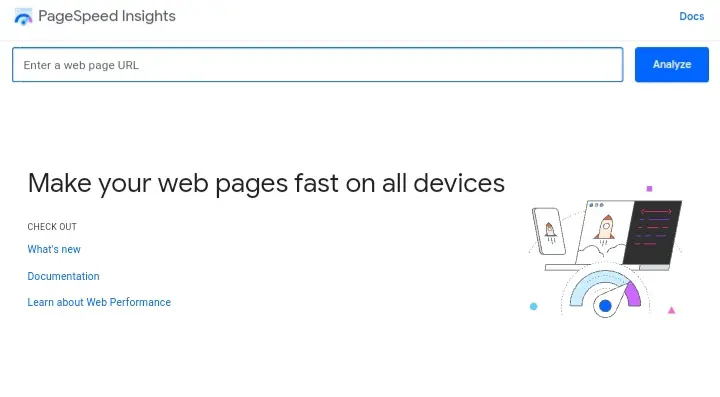
- Go to PageSpeed Insight.
- Insert your URL where you find the statement “Enter a web page URL.”
- Click on Analyze, and that’s all.
After a few seconds, the report of the analysis will be out with your performance score and further break done in different sections, which are:
- Field data section.
- Lab data section.
- Opportunities section.
- Diagnostics section.
- Passed audit section.
I have taken my time to explain all these sections above and what can be found in each section, and that should help you understand your PageSpeed Insight report better.
You can also switch from the mobile version of the report to the desktop top version of the report. These two versions will have a different report about your webpage speed, and the report from the desktop version is most often better than that in the mobile version.
But if you have a desktop-only web application, you can decide to ignore the mobile version of the PageSpeed Insight report.
How to improve your performance score in PageSpeed Insight.
The whole essence of running any analysis on a webpage is not just to get the performance score of the webpage page but also to improve the webpage performance, and PageSpeed Insight makes this easy for you to achieve.
Using PageSpeed Insight to analyze your webpage provides you with various reports broken down into sections giving you access to important information about your webpage.
But the section which helps the process of improving the performance of a webpage is the Opportunities Section.
The Opportunities section helps you locate the faults in your webpage and gives you information about each of them.
It also provides information on how these faults can be fixed, and it does all these in the form of suggestions. If you work on all the suggestions provided by PageSpeed Insight in the Opportunities section of the report one by one, then you are on your way to having a performance score in the “good” category, I.e., a score between 90 and 100.
Conclusion.
PageSpeed Insight is one of the best free tools you can make use of in measuring your webpage performance, and this is because it combines both the performance of the webpage on a predefined device and network services and the performance of the webpage with a real user giving you a clear view of your user experience (UX).
So you don’t have to use separate tools to measure the field data and lab data because PageSpeed Insight measures them both, and as I said earlier, it is a simple tool to use.
Have fun working with PageSpeed Insight.