Introduction
How your website ranks in Google search is one way to measure the website’s growth, and a website with performance issues will be less favored by google’s algorithm and rank lower on the SERP. As an SEO manager or website owner, this will derail your growth effort and affect your sales.
It is for this reason the team at VitalFrog recommend that you measure and monitor your web vitals, especially core web vitals. But what exactly are web vitals? What role do they play in the performance of your site?
What Are Web Vitals?
Web vitals are key metrics included in the Google ranking algorithm and are used to measure the user experience on a website. These metrics include:
- Largest Contentful Paint (LCP).
- First Contentful Paint (FCP).
- First Input Delay (FID).
- Speed Index.
- Time To First Byte (TTFB).
- Time To Interactive (TTI).
But the web vitals that Google use to measure the loading performance, interactiveness and visual stability are Largest Contentful Paint, First Input Delay, and Cumulative Layout Shift. They are the core web vitals. Check out this blog post for additional information on what the core web vitals are.
But in this article, we will be looking at the possible new web vitals that we should expect to be released by Google anytime from now. They will serve as improved metrics for measuring users’ experience with a webpage.
To be ahead of the curve in this, you have to be aware of these two new web vitals and understand how they work in auditing your website performance so you can prepare ahead before Google releases these metrics as new ranking factors.
I will be explaining these two new web vitals in this article, so you get to understand them and know what to do next.
New web Vitals

At the Chrome Dev Summit 2021, engineers from the Chrome developer team made key announcements about what they have done and are working on to improve the experience of users of the internet based on the feedback that they get from other developers.
Among the announcements made at the summit was the evolvement in the web vitals program, and this led to the introduction of two new web vital metrics, which are:
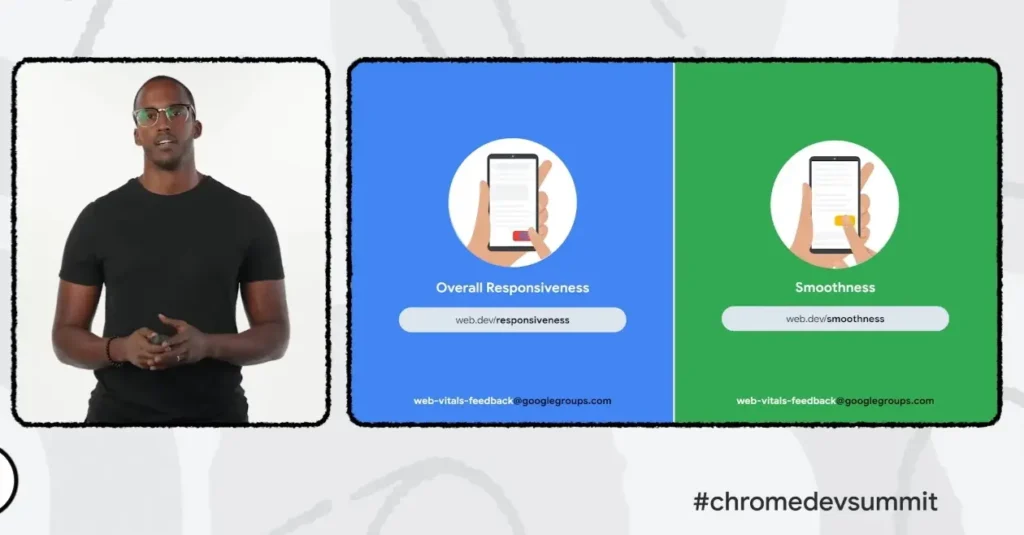
Houssein Djirdeh, a Developer Relations Engineer, says the Chrome Developer team are experimenting with these two metrics, and they are still in a developing stage. And I will advise you to care about them now before they are even released.
The core web vitals have been the only metrics available to measure your website performance, but these two metrics promise a better and more in-depth measuring of a website’s performance. Let’s check out what the metrics are.
1. Smoothness
The smoothness metric measures the scrolling and animation smoothness of a webpage to understand what a user experiences while using your website.

More often than not, you encounter web pages that freeze or hang when you are scrolling through the page or animations on webpages that load and are forced to reload or quit leaving you with a poor experience with the page.
Well, this new metric aims to understand better how often this problem occurs and how administrators of a website can solve it to improve their website performance better.
The smoothness metric is a metric that will help you understand how the animations on your website perform. Animations enhance user experience and interactivity, but when they are not correctly implemented in a webpage, they do the opposite and get a user frustrated.
Animations can either work by adjusting paint, layout or composite properties on your website, and this depends on the one you use. Getting them implemented adequately on your website is something you will need to focus on now.
What Factors Affect Your Website Smoothness.
The major factors that affect an animation smoothness on a webpage when rendered in a browser include:
1. Large content:
The content of an animation, which conveys the information of the animation, has its way of affecting the smoothness of the animation when it is too large.
Using large content in animation slows down the rate at which the animation is rendered in a user’s browser, and this will affect the speed of your website.
When these animations load slowly, it affects the user experience, and this is why the Chrome developers are putting in the work to get this metric ready.
But before then, they have released a method you can use to measure the smoothness of the animations on your website. I will be explaining how it works soon in this article.
2. Too many layers or frames:
For every animation, there are various layers involved which are different levels where you can place your drawings, object, or the content to be animated.
When the layers in animation and too many, then you should know that each of these layers needs to be rendered by a browser before they can be visible to a user. The more layer or frames there are, the longer it will take for the animation to be rendered, and this will affect other tasks the browser has to handle.
Also, the many layers in the animation will require too much Graphics Processing Unit (GPU) memory from a user’s device, and all of this affects the smoothness of your website. This needs to be resolved.
3. Complex CSS styles:
The CSS animation properties are used to change the properties of elements on a webpage and animate them on the page with the @keyframe.
But when the CSS styles used to animate the elements on a webpage are overly complex, it affects the smoothness of the webpage. You might need to use a less complex CSS style.
4. Using design anti-patterns:
According to the authors of Design Patterns;
“The anti-pattern is a commonly-used process, structure or pattern of action that, despite initially appearing to be an appropriate and effective response to a problem, has more bad consequences than good ones.” Source: Wikipedia
Anti-patterns are obvious solutions to problems on the web that end up being bad solutions to the problems in the long term because they end up generating another problem. You can look at them to be solutions with side effects.
Now when you go ahead to use a design anti-pattern which ends up disabling fast rendering optimizations on your website, then your website smoothness will be affected.
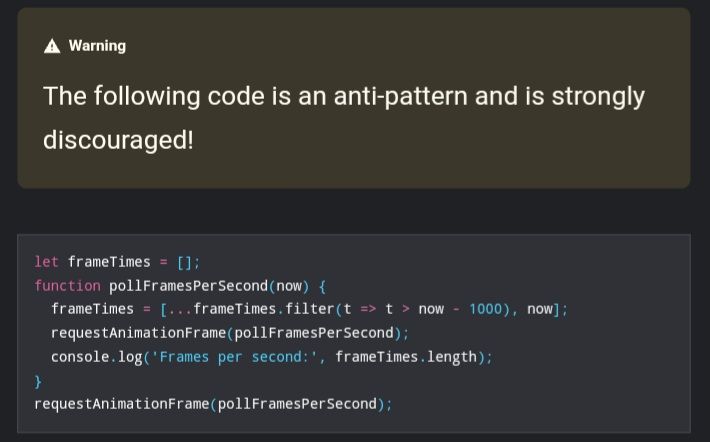
The Chrome developer team also discourages developers from using anti-patterns code like requestAnimationFrame() on the website due to the effect it causes on the site.
5. Too much work on the main thread:
As your webpage is being rendered by a user browser, all the tasks and Javascript code are executed on the browser’s main thread, and then the content of the page is delivered to the user.
When you make use of animations on a webpage, the various frames in it need to be rendered severally before a deadline so it can align with the visual update required.
If there is too much work on the main thread of a browser, especially render-blocking tasks that need to be executed while an animation’s next layer needs to be rendered as well, those tasks will block the layer, and users do not get to see the required visual update.
This affects the smoothness of the animation as the user will notice a pause in the animated element on the page, which can also affect your score on the existing core web vitals.
You can actually take care of this issue using Partytown, which takes off a load of intensive scripts on a webpage, like third-party scripts, off the main thread and moves them to a web worker.
You can do this by adding the command line using npm to install Partytown.
npm install @builder.io/partytownThen you have to include the type="text/partytown attribute to each third-party script you want to run with a web worker.
But even when the main thread is busy with other tasks, you need to know that this will not affect scrolling on the page. The page will continue to scroll smoothly, and this is because scrolling is entirely driven by a compositor thread. Here is a Junk Sample of an animation made by the Chrome developer team.
How To Measure Your Webpage’s Smoothness.
Animations are rendered information in frames or layers, but sometimes the frames are not fully rendered or are even skipped, which is something due to the factors explained above.
Ordinarily, to measure how the frames are rendered, the formula Frames Per Second (FPS) is used. It counts the number of frames (layers) rendered by the browser, but you need to know that having a higher Frame Per Second doesn’t translate to the overall smoothness of animations.
This is because a frame may be counted by the Frames Per Second (FPS) metric, yet it is partially presented and not visually complete to a user. This new metric is to measure the smoothness of a webpage from a user perspective, and so it can rely on FPS.
To accurately measure smoothness on a webpage, a suggested Percent Dropped Frames (PDF) metric was proposed, which would count the amount of dropped frames and check the partially rendered frames and offer an average score that is expected to indicate how smooth the animation is from the user’s point of view.
The Percentage Dropped Frames (PDF) does this using:
- The Average Percent Dropped.
- The Worst-Case of Percent Dropped Frames.
- The 95th percentile of Percent Dropped Frames.
And you can find your website score on these metrics by using Chrome developer tools or by using VitalFrog when you activate the experimental mode in the tool. Let us know if you need help with that.
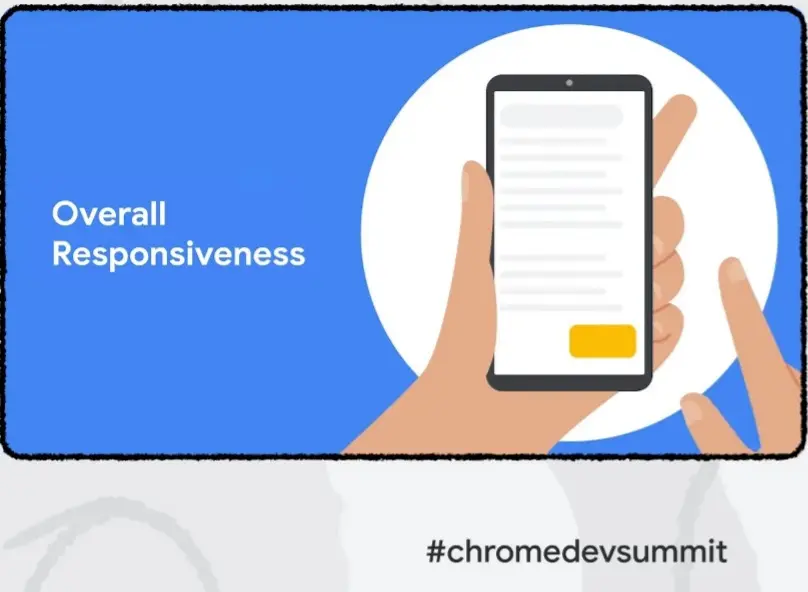
2. Overall Responsiveness
It is estimated that 70% of web users access the web from mobile devices. However, tons of websites are still not able to achieve a responsive user experience to fix the delay users face when interacting with a webpage on mobile and also on desktop.
Among the core web vitals, the First Input Delay (FID) lets you know how long this delay is experienced by a user when the first interaction with the page is made, neglecting every other interaction made by the user.
This new metric is developed to determine the end-to-end latency of individual events as well as the overall responsiveness of a website to all user input across the webpage’s lifespan.
The events will also be grouped as part of the same user interaction, and an aggregate score for all the interactions that occur on a webpage will be given.
The FID measures the delay in the input latency, i.e. the amount of time from when a user makes an interaction with your webpage to the time when the user’s browser begins to run the event handler. But this new metric, overall responsiveness, takes it further and measures how long it takes the entire event to be completed and the next frame is painted.
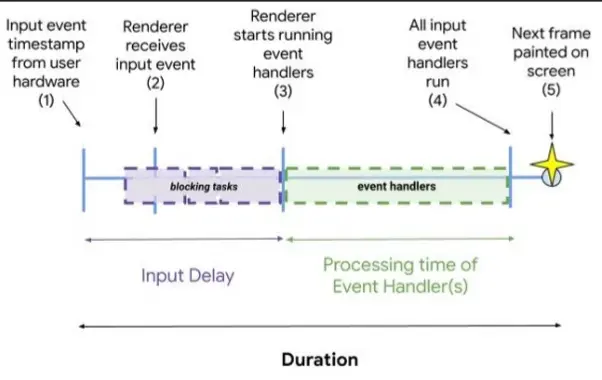
For events that do not cause any update or do not have a next frame to be displayed, the overall responsiveness metric will then measure the time from when the user made the input to when the event handling begins, and it stops when it is sure that the event is not to cause any update.
In other to provide an aggregate score for a webpage on its overall responsiveness, the new metric uses the following budget threshold for different interaction types.
| Interaction Type | Budget Threshold |
|---|---|
| Click/tap | 100 ms |
| Drag | 100 ms |
| Keyboard | 50 ms |
So if a user interacts with your webpage using a keyboard and experiences an input latency of 80 ms, then the latency over budget for that interaction is 30 ms.
The latency over budget is measured for every interaction made by a user throughout a webpage lifespan. The total and average interaction latency over budget is then calculated.
How To Measure Your Webpage’s Overall Responsiveness.
This metric intends to broaden the capture of the whole event time, from initial user input to the next frame being drawn once all event handlers are completed.
To measure the total interaction latency from a set of single event durations, here are some of the approaches that the chrome developer team are considering:
- Maximum event duration: This interaction latency is the same as the largest individual event duration from any event in the interaction group.
- Total event duration: This interaction latency is the total sum of all event durations without accounting for any overlap.
To find the values of the worst interaction latency, worst interaction latency over budget and the total interaction latency over budget, use the code sample below or try out VitalFrog experimental mode to measure these metrics. Let us know if you need help in setting up the experimental mode.
const interactionMap = new Map();
  let worstLatency = 0; let worstLatencyOverBudget = 0;
 let totalLatencyOverBudget = 0;
  new PerformanceObserver((entries) => {
   for (const entry of entries.getEntries()) {
     // Ignore entries without an interaction ID.
     if (entry.interactionId > 0) {
       // Get the interaction for this entry, or create one if it doesn't exist.
       let interaction = interactionMap.get(entry.interactionId);
       if (!interaction) {
         interaction = {latency: 0, entries: []};
         interactionMap.set(entry.interactionId, interaction);
       }
       interaction.entries.push(entry);
        const latency = Math.max(entry.duration, interaction.latency);
       worstLatency = Math.max(worstLatency, latency);
        const budget = entry.name.includes('key') ? 50 : 100;
       const latencyOverBudget = Math.max(latency - budget, 0);
       worstLatencyOverBudget = Math.max(
         latencyOverBudget,
         worstLatencyOverBudget,
       );
        if (latencyOverBudget) {
         const oldLatencyOverBudget = Math.max(interaction.latency - budget, 0);
         totalLatencyOverBudget += latencyOverBudget - oldLatencyOverBudget;
       }
        // Set the latency on the interaction so future events can reference.
       interaction.latency = latency;
        // Log the updated metric values.
       console.log({
         worstLatency,
         worstLatencyOverBudget,
         totalLatencyOverBudget,
       });
     }
   }
   // Set the `durationThreshold` to 50 to capture keyboard interactions
   // that are over-budget (the default `durationThreshold` is 100).
 }).
observe({type: 'event', buffered: true, durationThreshold: 50});
Because it is not currently feasible to estimate the entire number of interactions on a page in JavaScript, neither the average interaction over budget nor high quantile approximation strategies is included in the code above.
Summary:
On top of the already existing web vitals and core web vital, smoothness and overall responsiveness will give you an opportunity to measure User Experience on your website in a more in-depth way.
The Smoothness metric measures what your users experience when scrolling through your webpage or viewing an animation. While the Over Responsiveness metric measure how interactive your webpage is throughout its lifespan in a user’s browser.

Even as you prepare for these new metrics to be released, you can use the VitalFrog app to monitor your core web vitals and know when you are losing a spot in your hard-earned google rankings.
VitalFrog gives you an easy-to-use dashboard that visualizes your current web vital health for all your team members and alerts you when there is an issue.
Let us know your views on these possible new web vitals so we can help the Chrome developer team with the information needed to improve the Smoothness metrics and Over Responsiveness metrics so they get to release them soon.