How your website performs on the internet directly impacts your online marketing goals, and this is why it is essential to ensure that your website performs excellently.
Due to the complexity of how a website works, it is not accessible to measure its performance on your own. That is why you have various web performance metrics that make measuring your website’s performance a lot easier.
These metrics allow you to measure various aspects of your website, ranging from its load time to bounce rate and many more.
But even after you are able to measure these aspects of your website, it is essential for you to monitor them as well. This is where the term “Web Performance Monitoring” comes in.
What is Web Performance Monitoring?
Web Performance Monitoring refers to the practice of analyzing and monitoring a website’s performance based on various metrics to ensure that the website speed and user experience are optimal.
It is one of the types of Website Monitoring, and it involves the process of monitoring the various web performance metrics either by yourself or with the help of a tool which then reports back to you when the need arises.
Monitoring your web performance by yourself is going to be a challenging task to do and so using tools like VitalFrog to monitor your website performance is the best step to take as these tools will alert you when there is an issue, but not all tools can do this.
I will be working you through six different web performance metrics you can monitor and after that, we will check out the tools that we can use to monitor these metrics.
But before we get to that, there are some things I would like to clarify now, so you get to understand the concept of web performance monitoring in detail.
Why Is Web Performance Monitoring Important?
After the financial and time commitment you have made to build your website, you definitely would be expecting the website to assist you in achieving some specific goals, and these goals will guide you to know which web performance metrics you need to monitor.
But how do you know if your website is actually performing well toward your goals if you are not checking and monitoring its performance yourself?
This is why it is essential to monitor your website performance, so you get to know if your website is doing what you want it to do or not.
With the help of the web performance metrics, you can monitor your website speed, conversion rate, time to start rendering and many other aspects of your website.
By this, you get to know when your website isn’t performing as expected, and you know just what needs to be done to fix the performance issues.
But because there are so many web performance metrics, monitoring all of them can be time-consuming and costly if you are paying an organization to handle it for you. So you need to know which web performance metrics to focus on in your web performance monitoring process.
Which Web Performance Metric Should I Monitor?
When it comes to web performance monitoring, in other to make the best of your investment in this process, you have to find a few metrics and focus on monitoring them.
If you have a much larger team, you can delegate all the different web performance metrics to each team member, but this isn’t always the case, so focusing on a few will be effective.
Now the question is: “Which web performance metric should you focus on monitoring?”.
Focus on monitoring metrics that can help you identify if your website is actually achieving the business goals you set for it.
For example, if your goal is to rank on the first page of the Search Engine Result Page (SERP), then you should be monitoring metrics like core web vitals, keywords ranking, bounce rate and so on. And this is because these metrics are directly related to the goal of the ranking top.
If you don’t have issues with your website’s ranking performance and your goal is to make more sales through your website, then you should monitor metrics like conversion rate, website speed and so on.
The main point here is don’t just set out to monitor any metrics just because they can be monitored; monitor those that align with your goals, either short term or long term.
Types Of Web Performance Monitoring.
When monitoring any aspect of your website, including its performance, there are two types of monitoring involved, and these are:
1. Passive Monitoring:
Passive Monitoring is a technique used to monitor the users of a website and, in this case, to observe how the website performs when the users are on it.
It is also referred to as Real User Monitoring (RUM), and it provides you with the Field Data on the metrics you are monitoring, i.e. it gives you access to the data on the performance of your website with the users on the field.
The field data from passive monitoring helps you understand how your users experience your website performance and know when they have issues.
You can use Passive Monitoring to monitor your web performance metric, but because of the inefficiency of Passive Monitoring when there is little traffic to your website, you have Active Monitoring as an alternative.
2. Active Monitoring:
Active Monitoring is also referred to as Synthetic Monitoring. It is a technique used to monitor a website using a tool that stimulates records of different interactions with your website and observes the site’s performance while stimulating these interactions.
Unlike Passive Monitoring, Active Monitoring does not rely on the users to get its data, and the data obtained for Active Monitoring is called Lab Data.
Active Monitoring is used to monitor the web performance of a website when it has little traffic to rely on Passive Monitoring. But I advise you to use both the Passive and Active Monitoring to monitor your web performance metrics and not just rely on one data source.
The field data and the lab data are both valuable and needed in making data-driven decisions that will help you put your website on the right path to achieving your goals.
Ok, now let’s take a look at the various web performance metric available so you can identify which one aligns with your goals.
6 Web Performance Metric You Can Monitor.
To keep track of your website performance on some specific aspects, you need the help of the web performance metric that focuses on those aspects.
To help you find the very metrics that can help you achieve your goals, I will explain six different web performance metrics so you get to know which one needs to be monitored.
1. Website Speed:
The speed of your website is probably the most important metric as it can affect the various aspect of your website performance, like its User Experience (UX) and SEO rankings.
This metric gives you an insight into how fast your website is at different stages, and you should know that the attention span of internet users is short, so if anyone tries to open a webpage on your site, you need it to load as fast as possible.
But you can not possibly know if your website speed is slow if you don’t monitor it, so I would advise you to use the right tool to monitor your website speed and make sure your webpages load under 3 seconds.
The speed of a website can be broken down into various sections. This is because of the processes that take place in other to load a webpage in a browser which includes the following:
- The browser sends a request to your server.
- Your server processes the request and sends a response to the browser.
- The browser receives the response via the network and renders it to be displayed to the user, and the user can then interact with it.
There are metrics that focus on different sections of these processes, so they only measure an aspect of the speed of your website.
Some of these metrics include:
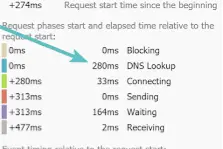
A. DNS Lookup Speed:
DNS lookup speed is a metric that tells you how long it takes your DNS (Domain Name System) to convert your domain name to its IP address.
When a browser tries to send a request to your server, the browser does not understand the text in your domain name, like www.vitalfrog.com; it only needs the IP address of the server hosting your website, so your Domain Name System needs to convert that text to the IP address.
How long it takes your DNS to do this conversion will affect your overall website speed, and the average DNS lookup time is 120 ms.
You can use both types of monitoring to monitor your DNS lookup speed.
B. Time To Start Render:
Time To Start Render is a metric that measures the time it takes for a user’s browser to begin the process of rendering the elements on your webpage after the user did click to open and load the page.
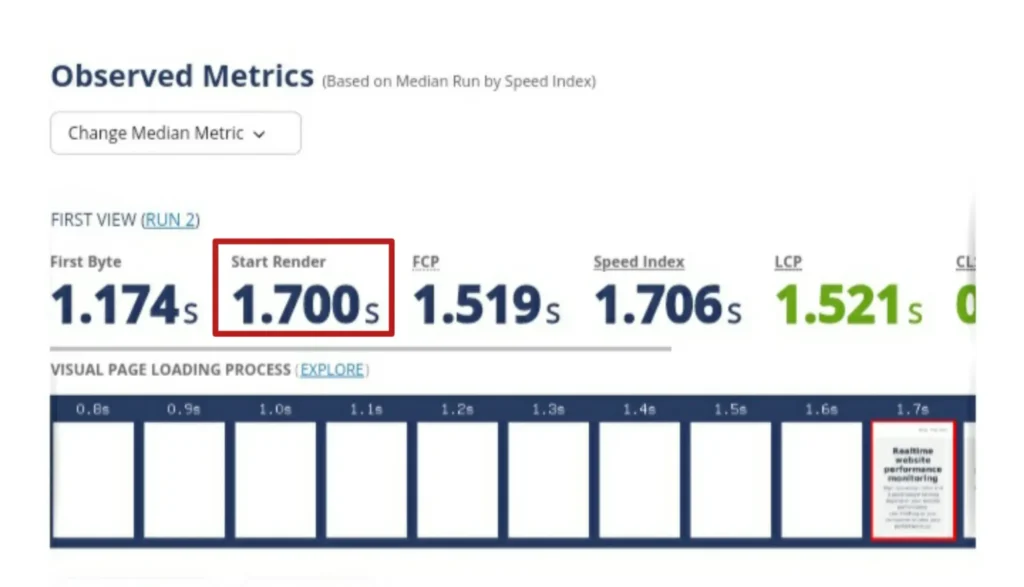
This metric starts measuring the time from when the user clicks on the link to your webpage to when the browser sends a request to your server after the DNS lookup has been settled.
Down to when your server processes the request and sends the response back to the browser via the network and finally stops when the browser begins to render the response, and that is why it is called Time To Start Render.
This is a metric that can be measured both in the field and lab, and this means you can use active and passive monitoring here.
C. Time To First Byte (TTFB):
Time To First Bytes is a speed metric that measures how fast the first byte of information from your server reaches a browser after the browser requested it.
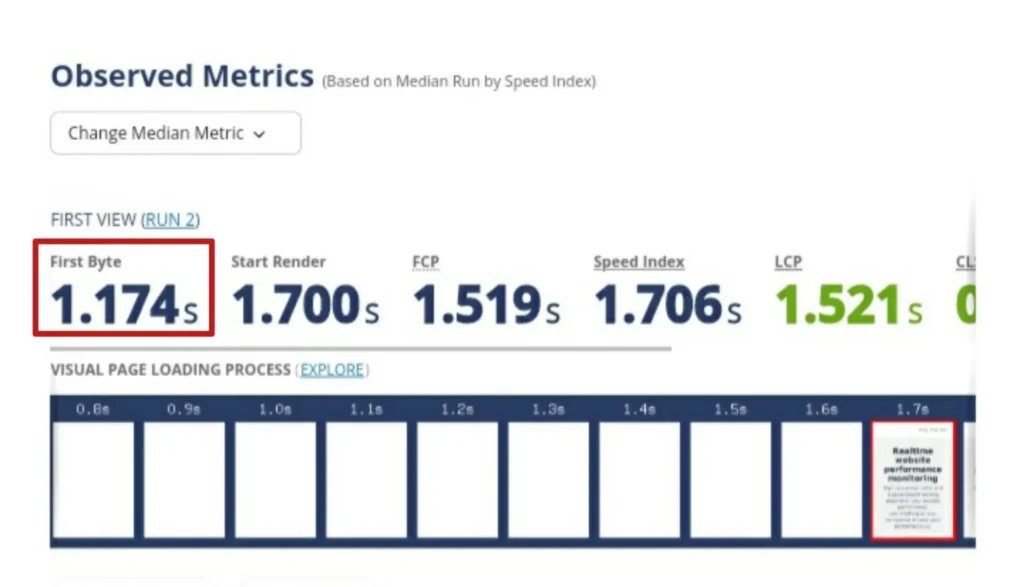
This is a metric that gives you a view of how fast your server response time is, and it is very important that the server you use in hosting your website has a good speed, as any delay from the server-side will affect the website speed.
It is also essential to know that the first byte of information that this metric uses is not necessarily visible information that a user can see on the screen.
D. First Contentful Paint (FCP):
First Contentful Paint is a metric that measures the time it takes for a user to see the first piece of content on a webpage.
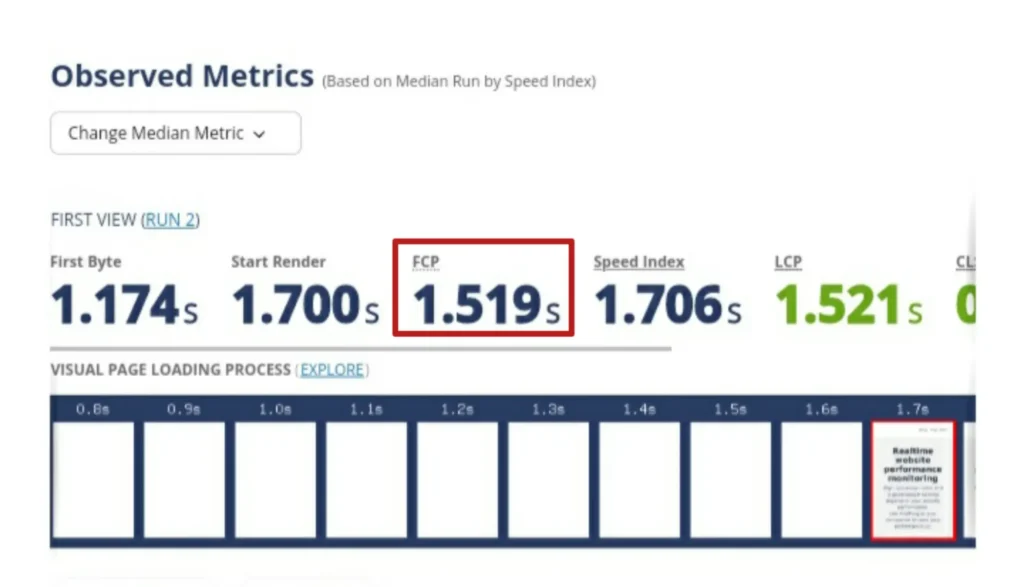
Different from TTFB, which uses a non-visible piece of information from the server, FCP uses the first piece of content that is visible to a user. This piece of content can be anything ranging from image to text or just any non-white element on the page.
When this first piece of content is displayed on time, it lets users know that the page is loading, and they can hang around for a while so the entire page can load completely.
According to Google, a good FCP score is 1800 ms, so you need to keep an eye on this metric and ensure that your score does not go above 1800 ms. If you check your FCP score and find out that it is above that, you can improve it.
E. Largest Contentful Paint (LCP):
Largest Contentful Paint is a metric that measures the time it takes the largest element on your webpage to be visible to a user.
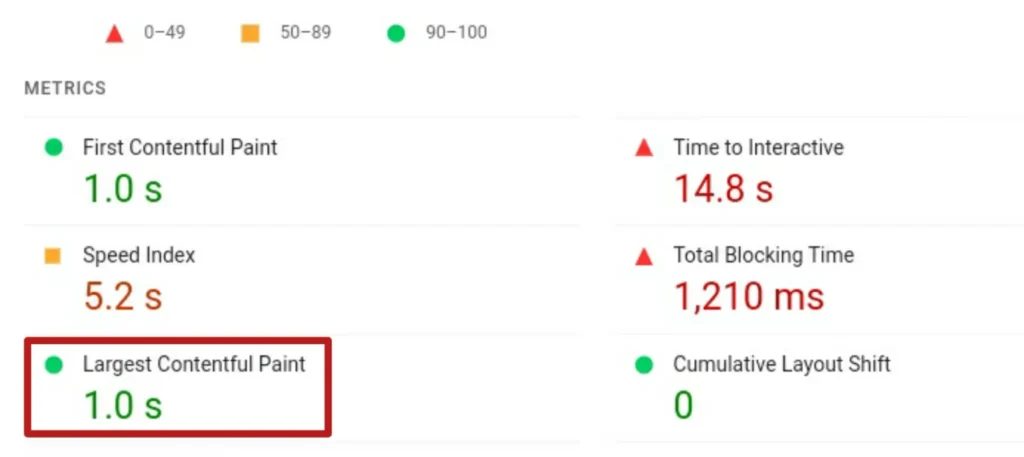
This largest element could be an image, H1 text or a video above the fold, and how long a user will have to wait before he can view this element is what the LCP measures.
When users can see the largest element on your webpage, they perceive that the page has loaded completely, which must happen within 2500 ms. Anything above that can get a user frustrated with the performance of your website.
F. Time To Interactive (TTI):
Time To Interactive is a metric that measures the time it takes for a webpage to be totally interactive and can respond to users’ input readily.
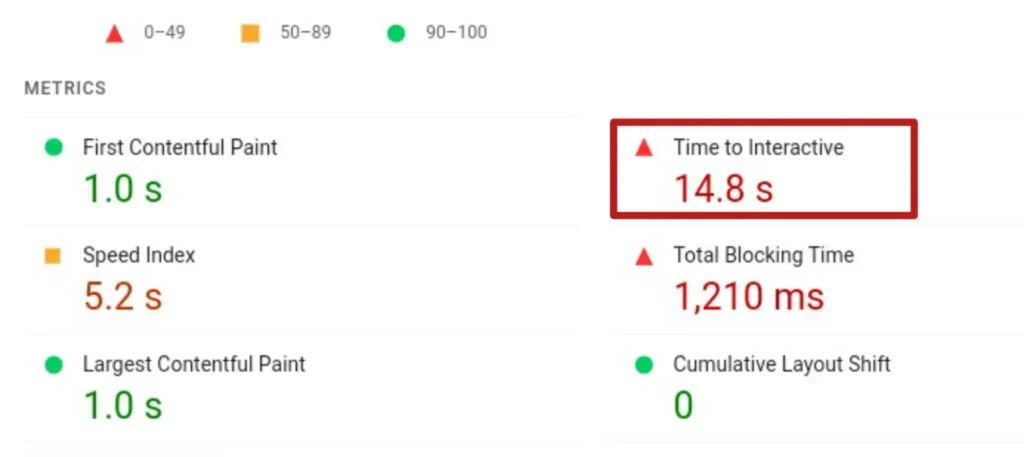
It basically lets you know how long it takes a browser to render your webpage completely and has no render-blocking task on its main thread.
This is different from how long it takes for the page to load, as a page might have loaded completely yet isn’t rendered completely.
A webpage can not respond to a user input readily without a delay until it is completely rendered, and so this is what the Time To Interactive (TTI) measures. How fast this happens is very important, and you need it to be within 3.8 seconds.
2. Error Rate:
Despite all the work you put into getting your website performance optimally, there are still some issues that you can’t just help, and Error Rate is a metric that you can use to keep track of these issues.
It measures the percentage of request issues your website has in relation to the total number of requests it receives.
It is important for you to keep an eye on this metric to avoid any spikes in the errors occurring on your website and prevent them from developing into a bigger problem in the future.
Monitoring your error rate lets you know the percentage of errors occurring on your website, what the major cause of the errors is, and from that, you get to know what needs to be done in other to fix the errors.
I believe this is a metric you need to monitor because you won’t achieve your goals with your website if the error rate is on the high side. Use a real user monitoring tool to monitor the errors as they occur. I will be showing you the right tool for this later on in this article.
3. Bounce Rate:
Bounce rate is a metric that measures the rate at which your website’s users depart from your site without interacting with it.
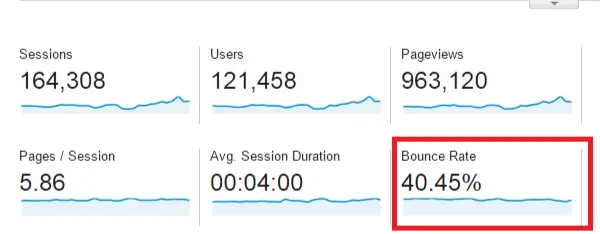
This is a metric that you can use to know if your website’s content delivers what the user wants and is compelling enough to get your users to take the desired action on your page.
When your bounce rate is high, it is a sign that your users find your website performance to be poor, and this can be as a result of poor site speed or other web performance metric issues.
Monitoring your bounce rate helps you know how often users leave your website as soon as they open it. And when this happens, it can impact your SEO rankings negatively and also affect your online sales – how can you offer your product to them when they leave as soon as they get in?
4. Conversion Rate:
Conversion rate is a metric that measures the performance of your website. It lets you know the number of your unique website visitors that are converted into consumers.
This metric measures the results and sales your website produces from the number of site users. When you have high traffic to your website and a low conversion rate, it is a sign that you need to adjust some things on your website.
But it is important to know that there are a lot of things that can influence your site’s conversion rate, and this could be its speed, the quality of traffic you get, the Call To Action (CTA) you make use of and so on.
So it is crucial to monitor your Conversion Rate to identify when other aspects of your website performance require improvements.
Although there is no tool that can measure the number of users that eventually becomes a consumer (this depends on your funnel), there are tools you can set to measure if a user performs a particular action like clicking your CTA or filling a form on your website.
When the users perform these actions, then the tool marks them as converts, but most times, this does not mean that they are your customers.
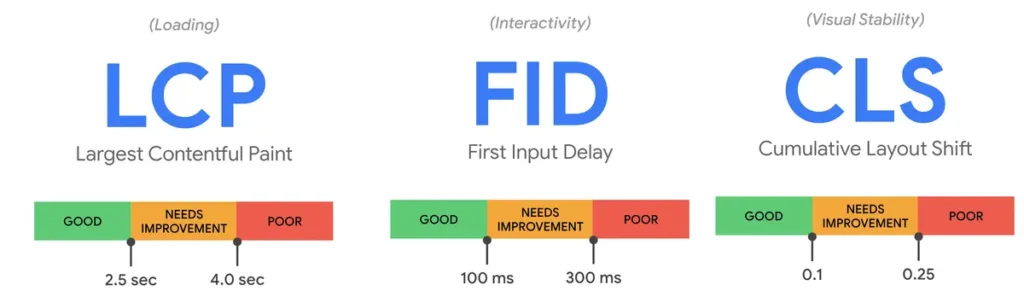
5. Core Web Vitals:
The Core Web Vitals include three different metrics that help you understand your website load performance, interactivity and visual stability.
These metrics include:
- Largest Contentful Paint (LCP)
- First Input Delay (FID) and
- Cumulative Layout Shift (CLS).
I have explained what the Largest Contentful Paint metric is under the Website Speed, which is the first web performance metric in this list. So what are the FID and CLS
- First Input Delay (FID): This metric measures the delay users experience when interacting with your website. To have a good website performance, this delay must be under 100 ms.
- Cumulative Layout Shift: This metric measures the unexpected shift in the contents on your website pages while they are loading. This shift can lead to a bad user experience indicating poor web performance.
The core web vitals are metrics you need to monitor as they give you access to three key performance metrics and let you know what issues your users are facing while using your website site.
And when you have a bad score on each of the core web vitals, you need to improve it as this can affect your SEO ranking and user experience.
6. Keywords Ranking:
If you aim to rank on the first page on the SERP for specific keywords, the Keywords Ranking is a metric you need to monitor alongside other metrics.
Keyword ranking is a metric that gives you information on the keywords you are ranking for and your ranking position for that keyword. Some tools also provide additional information to this, like the number of traffic you are getting from each of these keywords and so on.
With the Keywords Ranking metric, you can monitor your website’s performance on the search engine result page, and you get to know when you are losing your ranking position so you can fix it.
You can also use this metric to check out if your SEO strategies are working and also have a view of your progress so far.
Ok, you now know the metrics that you can use to measure various aspects of your website; let me show you the different tools you can use to monitor these metrics.
Tools For Web Performance Monitoring.
There are so many tools that you can use to monitor your web performance, but there is no one tool that can be used to monitor all the metrics. The tools all have a set of metrics that they monitor and focus on assisting you in those areas.
So your choice of a tool to monitor your website will be determined by the set of metrics you want to monitor and, as I said earlier, monitor the set of metrics that align with your business goal.
It is important for you to know that there are tools you could set to monitor your web performance metrics without you doing it yourself, and the tool alerts you when there is an issue that you need to fix. But not all tools offer this service.
To help you find the best tool that fits your needs, I will go through all the 6 web performance metrics explained above and suggest tools you can use to monitor them.
Here you have it.
| Web Performance Metrics | Web Performance Monitoring Tools |
|---|---|
| Website Speed | VitalFrog, GTmetrix, WebPage Test, PageSpeed Insight |
| Error Rate | Raygun, Bugsnag, Sematext |
| Bounce Rate | Google Analytics, Pingdom |
| Conversion Rate | HubSpot, Google Analytics, Adobe Analytics |
| Core Web Vitals | VitalFrog, GTmetrix, WebPage Test, PageSpeed Insight |
| Keywords Ranking | Ubersuggest, Ahrefs, Google Search Console, Semrush |
Conclusion:
Monitoring your website’s performance is one important task your business shouldn’t ignore for anything due to the benefits it gains by monitoring the aspects of the website that aligns with its goals.
And whichever web performance metric you choose to monitor, there are tools available that can help your monitor the metrics, and I have given you a list of these tools in this article.
So go ahead and begin your Web Performance Monitoring process today. Gather enough field and lab data to help you make data-driven decisions that can potentially double your website performance.
Are you looking forward to monitoring your website’s speed and core web vitals with ease all in one tool? Then VitalFrog is a tool for you.
Using VitalFrog gives you access to an easy-to-use dashboard that visualizes your website’s performance on the various website speed metrics and core web vitals with the Passive and Active Monitoring.
You can also set VitalFrog to monitor your website for you without you getting involved, and the tool will only reach out to you via e-mail when it notices an issue with your website performance.
Try VitalFrog or schedule a demo today.