Providing users with a good webpage experience can be achieved partly by having a fast-loading webpage and good Speed Index.
Some of the web vital metrics measure how fast a webpage loads, and each of these metrics measure a unique aspect of the webpage speed different from what other metrics will measure.
The vital web metric we will be focusing on now is the Speed Index and what aspect of the webpage speed it measures.
What is Speed Index:
The speed index is the measure of how quickly contents load and becomes visible while the webpage is loading. It measures how fast contents are visually displayed overtime during page load.
The speed index records how soon the user sees the visible contents above the fold when opening a webpage page.
How is Speed Index measured?
From the definition, the speed index measures how quickly content becomes visible while the page is loading; that is, it measures the time it takes for a user to see content on their screen, and this is why the speed index score depends on the viewpoint of the browser.
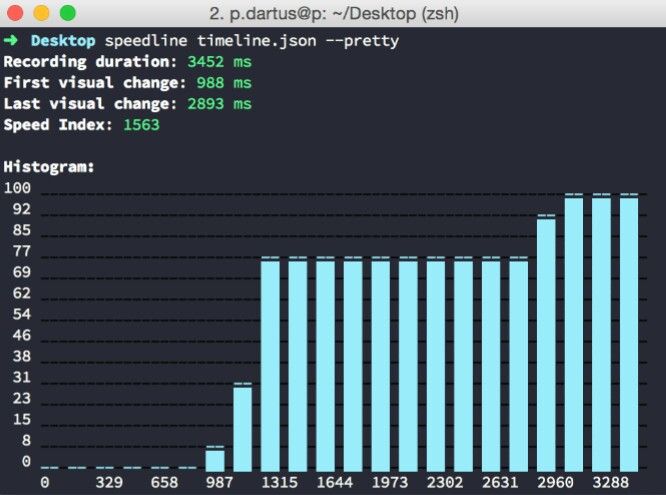
The speed index score is obtained by measuring the time taken for each element of the webpage to load, and this is computed to give the Speed Index score.
This is done by capturing the progress of the webpage while it loads and then checking for visual completeness between the visual frames taken at different intervals.
The visual frames above the fold are scored for visual completeness until all the web page’s content is visible. I.e., the moment when the page is visually complete.
The visual progression from frame to frame is computed to give the page’s speed index. Lighthouse makes use of Speedline Node.js module to create the Speed Index score.
The speed index is one of the web’s vital metrics that helps to measure the experience of a user with a loading webpage. A user expects the content of a webpage to be displayed as soon as they open the page.
If there is a delay or the page content takes much time to be displayed, the user gets frustrated and finally leaves the page, and that is why having a lower Speed index score is very important.
What is a good Speed Index Score?
The Speed Index Score represents how fast contents become visible to a user, and the quicker this happens, the better it is for your user experience (UX).
Lighthouse is one of the lab tools that can be used to measure the speed index of a webpage, and according to Lighthouse ranting for the speed index score, a webpage page with a speed index score below 3.4 seconds is considered to be good, and this means that the contents on that webpage become visible fast.
So when optimizing your webpage page for speed index score, aim at having a score less than 3.4 seconds.
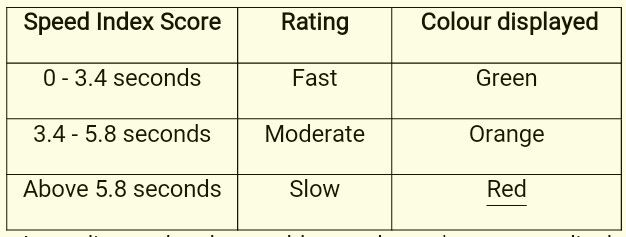
According to the above table, a webpage’s contents display fast with a speed index score between 0 – 3.4 seconds.
If the speed index score is between 3.4 seconds and 5.8 seconds, then this is an average score, but it needs to be improved, so it does not get a user frustrated when making use of it.
Having a Speed Index score above 5.8 seconds is a sign that the contents on your webpage display at a slow rate, and the color display by Lighthouse for these scores is red. This affects the user experience with your webpage.
How to measure the Speed Index.
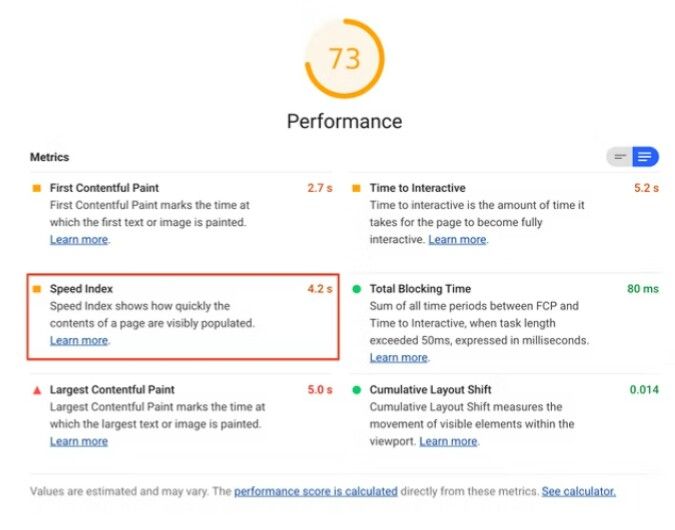
The speed index of a webpage can be measured using Lab tools, and just as I mentioned early, Lighthouse. is one of the lab tools you can use to measure the speed index of your webpage.
Other tools used to measure the Speed Index include:
The result obtained from these tools will give you a sense of how a user experiences your webpage, and this can be very helpful to know when there is a need to improve the speed of your webpage.
Always aim at having a speed index score below 3.4 seconds, but if your webpage’s speed index score is above 3.4 seconds, tools like VitalFrog gives you opportunities or suggestions on what needs to be done in other to improve the speed index score of your page.
The lab tools also help you identify any significant improvement that your webpage requires, and when these improvements are made, the score for the Speed Index and other metrics will be improved.
Difference Between Speed Index, FCP, and LCP.
Speed Index measures how quickly contents load and are visible, i.e., how fast contents are visually displayed over time while the webpage is loading.
But First Contentful Paint (FCP) measures when the browser renders the first piece of content in the DOM, which can be any text, image (including background images), non-white canvas, or SVG, providing feedback to the user that the page is loading. This excludes any content of iframes but includes text with pending web fonts.
That is, First Contentful Paint (FCP) is a measure of how long a user needs to wait before they can see the first content on a webpage above the fold, to get a feel that the page is actually loading.
The Large Contentful Paint (LCP) is a core web vitals that measures how long it takes the largest content on a website to become visible within the viewport, relative to when the page first started loading.
So, Large Contentful Paint (LCP) is a measure of how long a user has to wait before they can view the largest content on the webpage above the fold.
The First Contentful Paint (FCP) and Large Contentful Paint (LCP) of a webpage are both milestones on the loading timeline of a page.
But different from the First and Large Contentful Paint, the Speed Index of a webpage is not a milestone on the page’s loading timeline.
It is also important to know that when a page is visually complete, it does not mean that it has loaded completely. The page can still be loading components in the background and keep the browser’s main thread busy, but as long as the loading components do not affect the viewpoint that the user can see, then the Speed Index is not affected.
Therefore it is possible for a webpage to be visually complete and yet not interactive because the browser’s main thread is not idle, and this is what makes the difference between the Speed Index metric and the Time To Interactive (TTI) metric.
How to improve the Speed Index Score.
The Speed Index metric is one that is important, and taking steps to improve the speed index score will also improve the score of other metrics at the same time.
The steps taken to improve other web vital metrics that have to do with the time taken for a webpage to load will also help in improving the speed index score.
But when optimizing a webpage, it is best to work on the suggestions provided by the lab tool as they help in locating the exact element or task that affects the page’s speed index score.
But here are three general steps to take when improving or optimizing the speed index score.
- Ensure text remains visible.
- Lazyload, how it affects your score.
- Reduce the main thread work.
1. Ensure text remains visible:
The speed index measures how quickly elements on a webpage are visible, so one way to improve the speed index score is to make sure that displayed text on the webpage remains visible while the webpage is loading.
The text should also be made visible fast so that the speed index score can fall between 0 – 3.4 seconds.
This can be achieved by making use of fonts that exist in the user’s system before using the font-display: swap; CSS property. Here is an example of how this is done:
@font-face { font-family: 'Pacifico'; font-style: normal; font-weight: 400; src: local('Pacifico Regular'), local('Pacifico-Regular'), url(https://fonts.gstatic.com/s/pacifico/v12/FwZY7-Qmy14u9lezJ-6H6MmBp0u-.woff2) format('woff2'); font-display: swap; }If you are making use of Google font, you can make use of the &display=swap parameter by adding it to the URL of the font. Here is an example of this:
<link href="https://fonts.googleapis.com/css?family=Roboto:400,700&display=swap" rel="stylesheet">You can also decide to preload the text on the webpage to make them display fast using the preload attribute with the <link> element.
Also, avoid making use of heavy text fonts that will take a long time to be rendered by the browsers’ main thread, as this will affect the speed index score negatively.
2. Lazyload, how it affects your score:
Lazyloading elements on a webpage is a very effective way of improving the Time To Interactive score of a webpage, but this can affect your speed index score if images or other elements on the viewpoint are all lazyloading.
Lazyloading elements on the viewpoint will make these elements appear visible slowly, and when the speed index is measured, the score will be high because the elements do not become visible quickly.
But this can be avoided by excluding elements above the fold from lazyloading, and the lazyload attribute can be left for elements below the fold.
3. Reduce the main thread work:
The browser’s main thread is responsible for the execution of tasks, including JavaScript and the DOM tree of the documents on the webpage.
The faster the main thread executes these tasks and displays the last visible element in the viewpoint, the better the speed index score.
So, reducing the number of tasks the main thread works on before giving a complete visual viewpoint will help in improving your speed index score.
The workload on the main thread can be reduced by the use of web workers to run tasks that do not interfere with the user interface (UI), making it possible for the main thread to render the elements on the viewpoint and make them visible on time.
The web worker executes tasks assigned to it on a separate thread called the worker thread, and the worker thread is able to communicate with the main thread of the browser.
Another way of reducing the main thread work is by optimizing all your JavaScript and CSS codes.
This can be done by breaking down long tasks into smaller tasks, deferring heavy JavaScript codes, especially third-party scripts, and deleting unused JavaScript.
If all these are done properly and you have a well-optimized webpage, the speed index score of the page will improve.
Conclusion:
The valuable content your webpage carries will become useless if the user has to wait for long, gets frustrated, and leaves the webpage without viewing them, and this is why the speed index is an important metric.
Contents on the viewpoint need to become visible fast for their value to be seen; otherwise, your webpage gets a high bounce rate, and this will lead to low conversion.
The user experience also depends on what your speed index and some other metrics scores are, and this reflects how important it is to improve your speed index score.
You can make use of VitalFrog today to measure your webpage’s speed index and follow the steps explained above to improve your score.